
Abstract
Aim: Early and appropriate nutritional support plays a fundamental role in the management of critically ill patients; however, its clinical and economic implications, particularly regarding the choice between nutritional routes (enteral vs. parenteral) for patients in coronary intensive care, remain inadequately characterized. This study investigates the combined effects of nutritional route and nutritional risk on hospital costs and length of stay among patients in the coronary intensive care unit.
Methods: Data from 217 patients in the coronary intensive care unit (ICU) were analyzed. Linear regression and analysis of covariance were used to evaluate associations between nutritional approach and total hospitalization cost, adjusting for age, sex, C-reactive protein level, diabetes status, and length of stay.
Results: In the basic model, a longer length of stay was significantly associated with increased costs, whereas enteral nutrition (EN) was associated with lower costs. In alternative models, EN continued to limit cost escalation even during prolonged stays. The absence of nutritional risk was also associated with smaller increases in costs related to prolonged hospitalization. Patients who received EN, who had prolonged stays, and who demonstrated no nutritional risk experienced the greatest cost reductions.
Conclusion: The interaction between length of stay and nutritional approach is a major determinant of hospital costs for patients in the coronary ICU. Enteral nutrition appears to be associated with a more favorable cost trajectory during prolonged stays in the ICU. Routine nutritional risk assessment and appropriate selection of the nutritional support route may contribute to optimizing outcomes and controlling expenditures. Policies that encourage evidence-based use of EN and proactive nutritional risk management may yield meaningful clinical and economic benefits.
Keywords: Intensive care units, hospital costs, length of stay, risk assessment, risk management
Introduction
Intensive care units (ICUs) are specialized environments equipped with advanced resources and highly trained personnel to manage life-threatening conditions and monitor patients at risk of rapid clinical deterioration (). Among the factors influencing outcomes in critically ill patients, malnutrition is a major determinant of morbidity, mortality, prolonged length of stay (LOS), and increased healthcare costs (-). Nutritional support is therefore a cornerstone of ICU care, aiming to provide adequate energy and nutrients through enteral nutrition (EN) or parenteral nutrition (PN) (-). A study has consistently demonstrated that optimized nutritional therapy improves clinical outcomes (). International guidelines recommend early initiation of EN whenever clinically feasible because of its beneficial effects on gastrointestinal integrity, reduced risk of infection, shorter LOS, and lower healthcare costs (). In contrast, PN is primarily recommended when EN is contraindicated or fails to meet nutritional requirements, as PN is associated with a higher risk of metabolic and infectious complications and requires careful patient selection and close metabolic monitoring ().
Despite these established benefits, evidence regarding the economic implications of nutritional strategies in coronary intensive care units (C-ICUs) remains limited. Patients admitted to C-ICUs have distinct hemodynamic and metabolic characteristics that may influence both nutritional management and resource utilization; yet previous studies have generally evaluated nutritional route and nutritional risk independently rather than considering their combined effects on hospital costs. We hypothesized that EN would be associated with lower hospital costs than PN; that higher nutritional risk would be associated with increased costs; and that the association between prolonged LOS and hospital costs would vary according to nutritional route, with a smaller increase in costs associated with longer hospitalization among patients receiving EN.
Accordingly, the primary objective of this study was to evaluate the association of the nutritional approach [defined by the route of nutritional support (EN vs. PN)] and nutritional risk with total hospital costs among patients admitted to the C-ICU. The secondary objective was to determine whether the relationship between LOS and hospital costs was modified by nutritional route and nutritional risk. Accordingly, the primary outcome was total hospital cost. The secondary outcomes were the interaction effects of nutritional route × LOS and nutritional risk × LOS on hospital costs and were estimated using analysis of covariance models adjusted for age, sex, C-reactive protein (CRP), diabetes status, and LOS. This study is expected to provide clinically relevant evidence supporting early nutritional risk assessment and the timely implementation of EN, thereby contributing to more cost-effective nutritional management and improved resource utilization in C-ICUs.
Materials and Methods
Compliance with Ethical Standards
Ethical approval was obtained from the Izmir Katip Celebi University Social Research Ethics Committee (approval number: 2025/24-07, date: 10.12.2025).
Study Design
This single-center, retrospective, observational, analytical study used routinely collected electronic health records of adult patients admitted to the coronary ICU. Patient data were obtained from the hospital records, with no intervention in clinical decision-making or alteration of patients’ nutritional management. This design enabled the assessment of associations between nutritional support strategies, nutritional risk status, length of hospital stay, and total hospital costs within the context of routine clinical practice. This study was conducted from the perspective of the Turkish Social Security Institution (SSI), and all hospital costs reflected SSI reimbursement payments rather than actual hospital expenditures. The study population consisted of adult patients admitted to the ICU (secondary-level care) at Izmir Bakircay University Cigli Training and Research Hospital between January 1, 2020, and December 31, 2024. From this population, 217 adult patients with complete electronic records were included in the analysis. The overall study flow, including patient selection and analytical procedures, is presented in . For context, Kalın et al. () examined 100 patients when investigating the relationship between nutritional risk and length of stay. As this was a retrospective study encompassing all eligible patients within the predefined study period, a priori sample size calculation was not conducted. Compared with this previous study, the inclusion of 217 patients in the present study provided an appropriate study population to examine the proposed relationships and to evaluate interaction effects between nutritional approach and length of stay. To further assess the adequacy of the available sample relative to the complexity of the final model, a sensitivity analysis was performed using G*Power 3.1.9.7 with eight model terms (seven main effects and one three-way interaction), an α level of 0.05, and 80% power. The minimum detectable effect size was determined to be f2=0.0365.
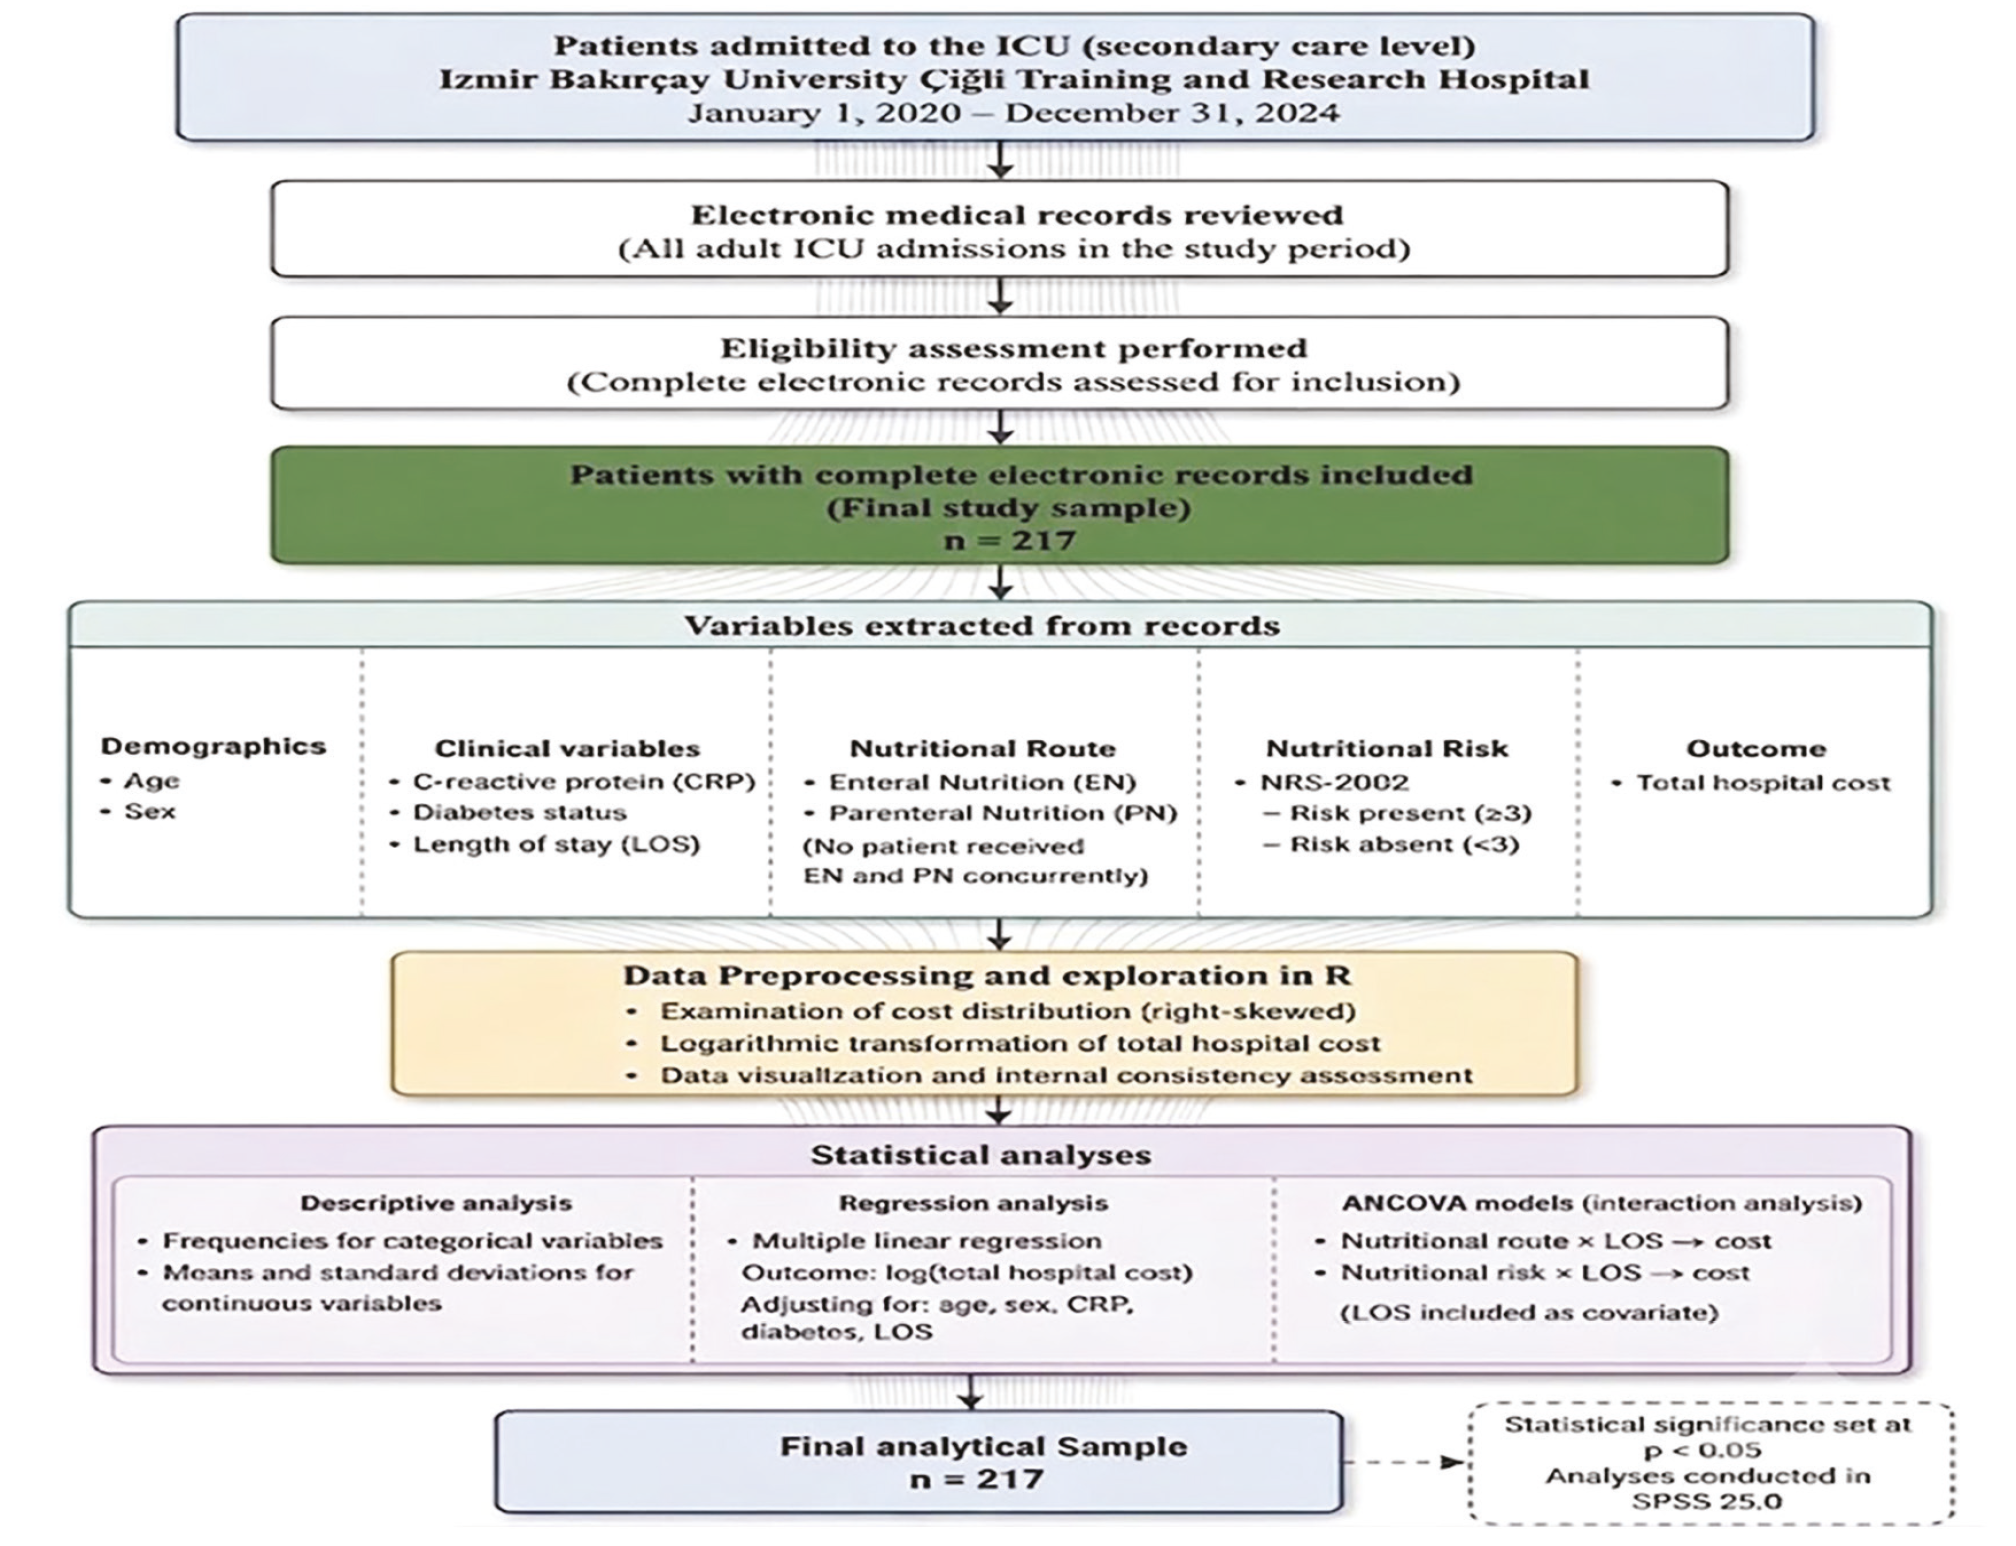
Study flow diagram and analytical framework
ICU: Intensive care unit; EN: Enteral nutrition; PN: parenteral nutrition; NRS-2002: Nutritional risk screening 2002; LOS: Length of stay; CRP: C-reactive protein
This study employed a two-stage analytical framework designed to estimate baseline associations and evaluate how the association between LOS and cost varied by nutritional approach. The basic model used linear regression, while the alternative models applied analysis of covariance to estimate interaction effects. Because the outcome variable, total hospital cost, was continuous and heavily right-skewed, its distribution was examined using R (), and substantial positive skewness was observed. Consistent with Alpar’s recommendations for skewed cost data (), a logarithmic transformation was applied to ensure compliance with multivariable model assumptions.
The key independent variables were route of nutritional support (EN vs. PN) and nutritional risk (present vs. absent), which together operationalized the nutritional approach. Both variables were modeled categorically. Covariates included age, sex, CRP, diabetes status, and LOS. These variables were selected based on their theoretical and empirical relevance to cost variation in ICU populations. Age was treated as a discrete numerical variable, LOS and CRP as continuous variables, and diabetes status as a categorical variable. The conceptual model of factors influencing costs in C-ICU patients is presented in .
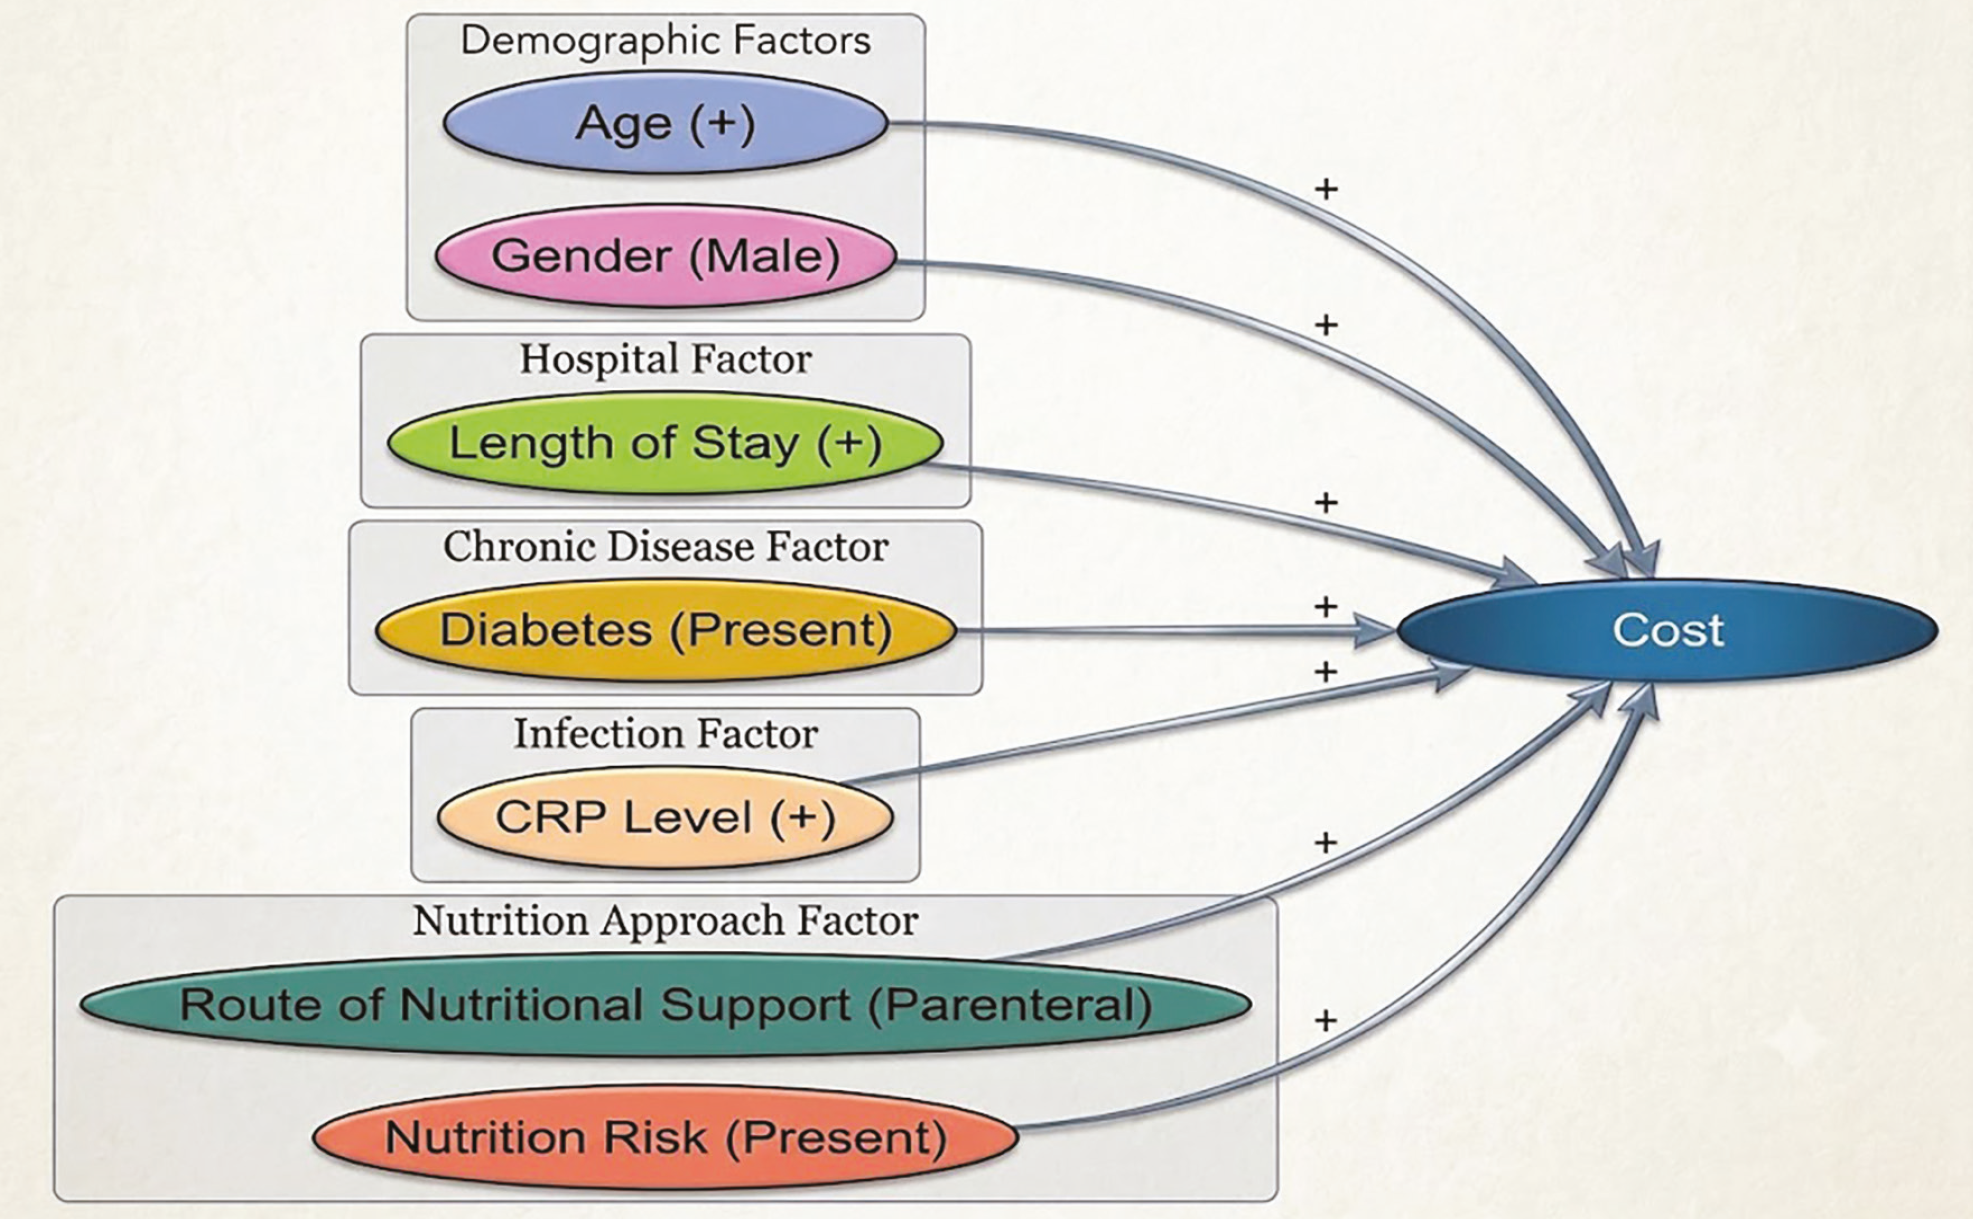
Conceptual model of factors affecting costs in C-ICU
C-ICU: Coronary intensive care unit
summarizes the conceptual framework linking demographic, hospital-related, chronic disease, infection-related, and nutritional factors to hospital costs. Each factor was assumed to exert a positive effect on cost because of higher resource utilization or greater clinical complexity. Specifically, longer LOS was expected to increase hospital costs because of extended treatment requirements; diabetes and elevated CRP were expected to increase hospital costs as indicators of greater disease severity; and, from a nutritional perspective, PN and nutritional risk [based on Nutritional Risk Screening 2002 (NRS-2002)] were expected to increase hospital costs.
Diabetes status was determined using ICD-10 code E11. The nutritional route was extracted from medication records: patients receiving enteral products were classified as EN, and those receiving parenteral products were classified as PN. No patient received EN and PN concurrently. Nutritional risk was assessed using NRS-2002, a validated and widely recommended screening tool for predicting adverse outcomes in ICU settings. Previous studies also confirmed NRS-2002 as a strong predictor of clinical trajectories in critically ill patients (,). Patients with NRS-2002 scores of ≥3 were classified as having nutritional risk, whereas those with scores <3 were classified as having no nutritional risk.
Statistical Analysis
Descriptive statistics summarized the sample using frequencies for categorical variables and means with standard deviations for continuous variables. Differences between groups were evaluated using the chi-square test for categorical variables and the independent samples t-test for continuous variables (). Initial data exploration was performed using visual tools in R () to assess internal consistency. The findings of the initial data exploration, including the distribution of the outcome variable and assessment of data characteristics, were presented in .
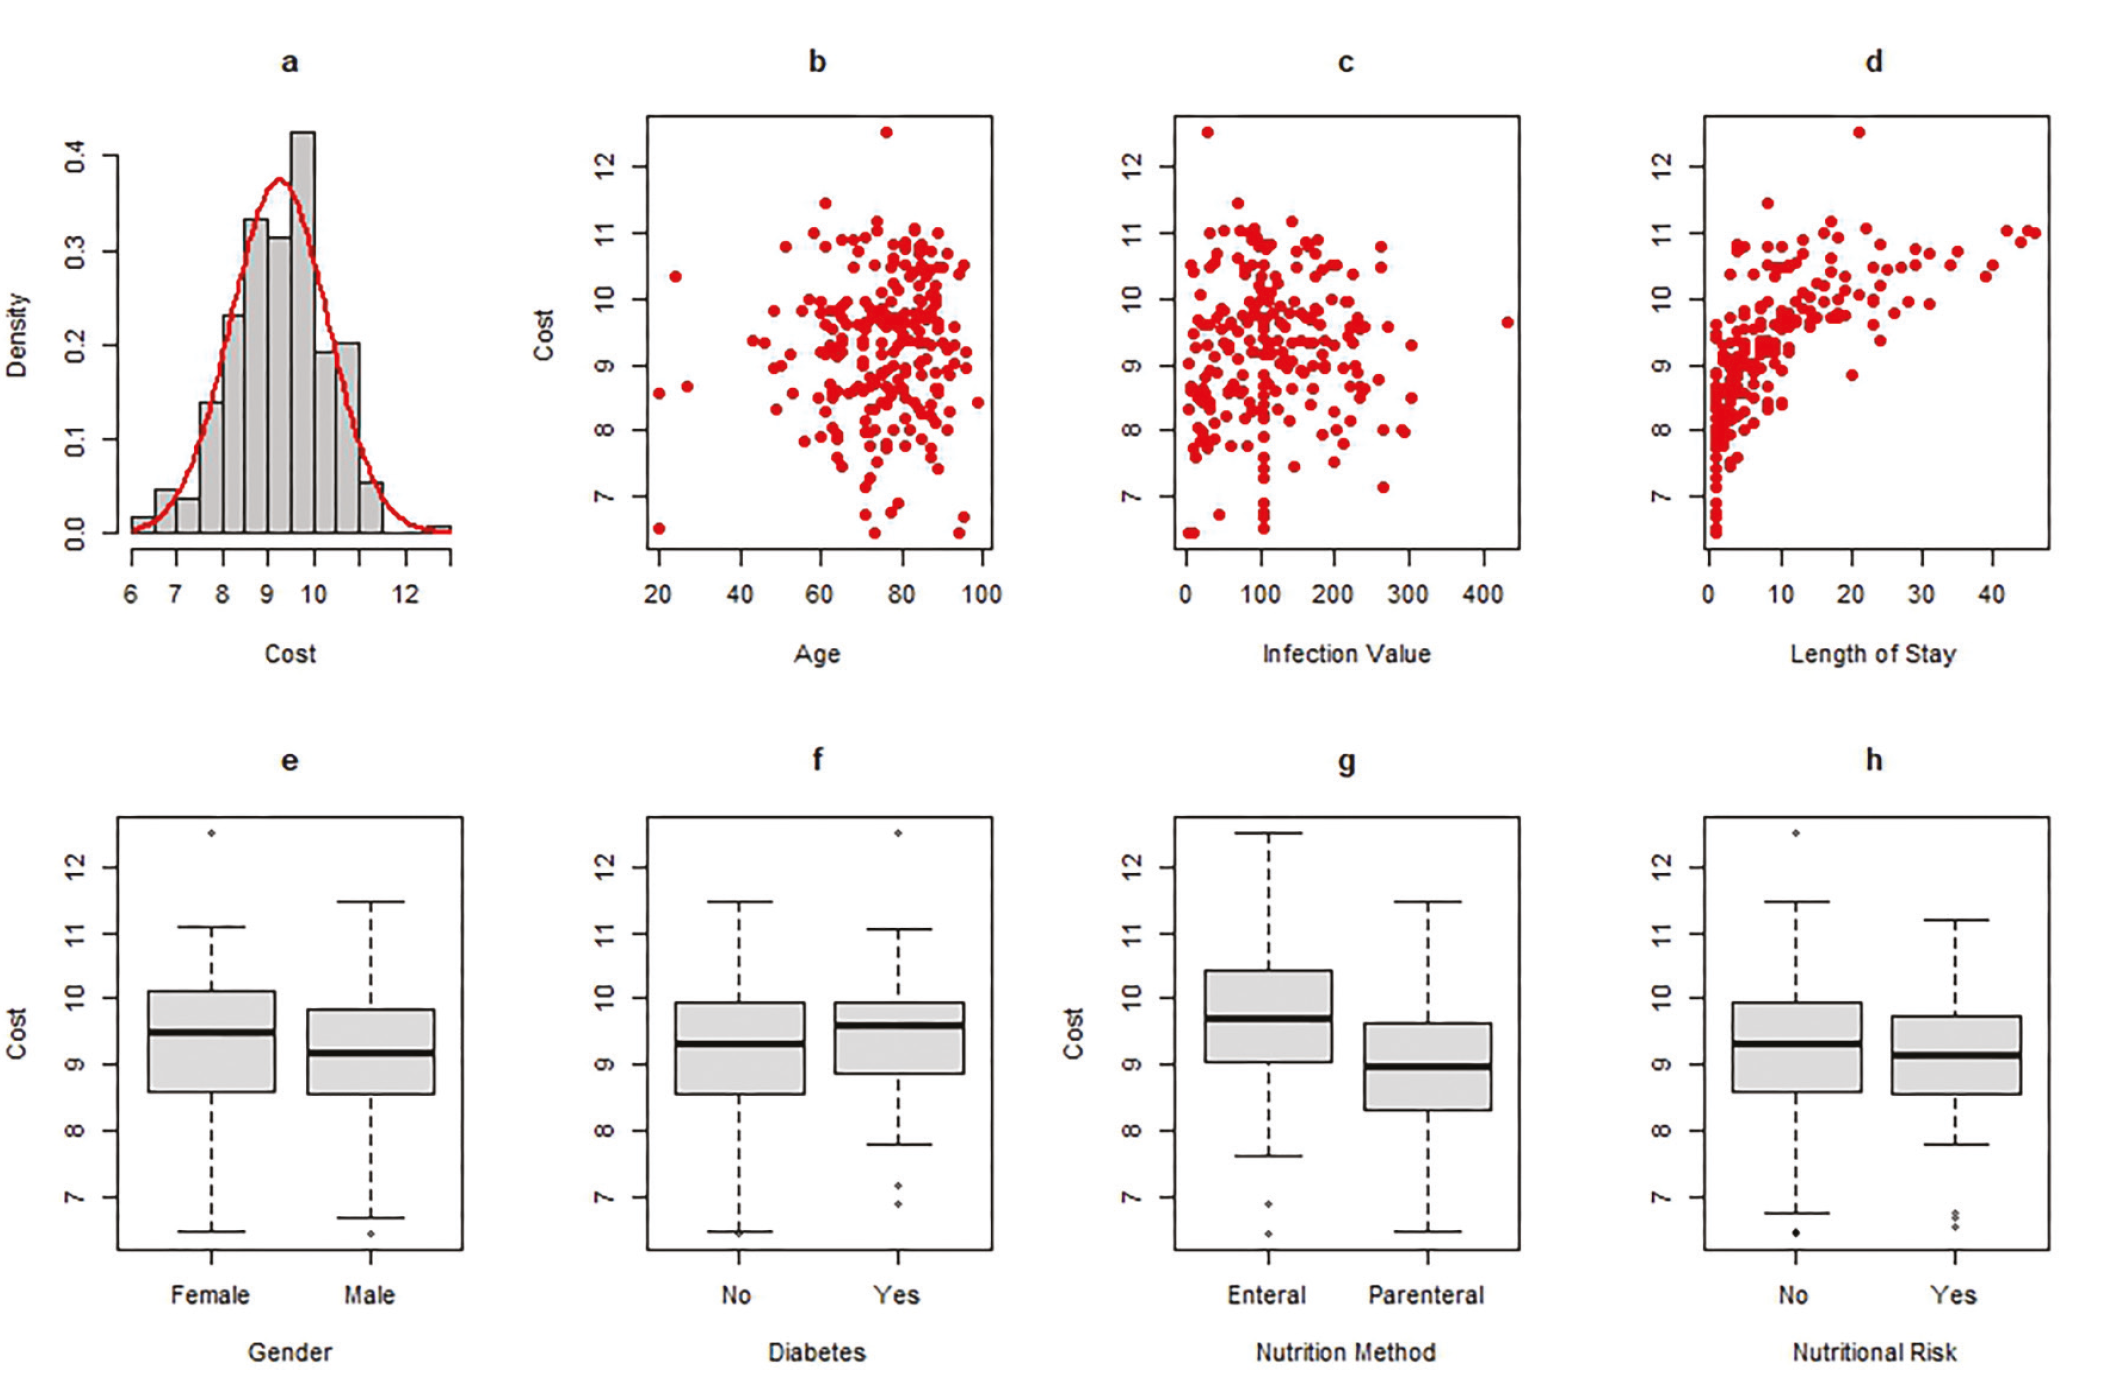
Findings on the relationship between clinical and demographic variables and costs in C-ICU patients. Associations between individual variables and hospitalization cost (log-transformed) were assessed using Pearson correlation for continuous variables and independent samples t-test for categorical variables. Panel (a) shows the distribution of the transformed cost variable; panels (b-h) show bivariate associations between individual variables and cost. Statistical significance was set at p<0.05
EN: Enteral nutrition, PN: Parenteral nutrition, CRP: C-reactive protein, LOS: Length of stay, C-ICU: Coronary intensive care unit
Regression analysis estimated the association between nutritional approach and log-transformed hospital cost while adjusting for covariates (,,). Covariance models were then used to evaluate whether the relationship between LOS and hospital costs varied by nutritional route and nutritional risk. The rationale for using analysis of covariance was its suitability for estimating moderated effects by incorporating LOS as a covariate alongside categorical predictors (). The assumption of linearity between LOS and hospital cost was confirmed.
Data preprocessing and visualization were performed using R (), whereas regression and covariance analyses were conducted using SPSS version 25.0 (IBM Corp., Armonk, NY, USA) (). Statistical significance was set at p<0.05. All analyses were conducted under the assumption that hospital data were accurate and reliable. All cost figures were reported in US dollars (USD). Original cost data were recorded in Turkish lira (TRY) and converted using the 2024 annual average exchange rate published by the (Central Bank of the Republic of Türkiye: 1 USD=32.51 TRY), which was applied uniformly across the study period for consistency in reporting. This study utilized specialized AI tools to enhance its rigor and efficiency: Notebook LM () for literature synthesis, ChatGPT () for English translation, and Claude AI () for proofreading and linguistic refinement. The authors remain fully responsible for the final content and interpretations.
Results
Patient characteristics are presented in . Of the 217 C-ICU patients, the mean age was 75.17±13.25 years, 55.3% were male, and 11.5% had diabetes. PN was administered more frequently than EN (57.6% vs. 42.4%), and nutritional risk was present in 15.7% of patients. Mean LOS was 9.34±9.42 days and the mean total hospital cost was $544.34±$730.84. Patients receiving EN were significantly older and had longer hospital stays, higher total hospital costs, and higher daily costs than those receiving PN (p=0.029, p<0.001, p=0.002, and p<0.001, respectively).
Table 1. Descriptive findings on demographic and clinical variables
Variables | Total | EN | PN | p | |||
|---|---|---|---|---|---|---|---|
n | % | n | % | n | % | ||
Route of nutritional support | 217 | 100.0 | 92 | 42.4 | 125 | 57.6 | - |
Gender | 0.072 | ||||||
Female | 97 | 44.7 | 48 | 52.2 | 49 | 39.2 | |
Male | 120 | 55.3 | 44 | 47.8 | 76 | 60.8 | |
Presence of diabetes | 0.290 | ||||||
Absent | 192 | 88.5 | 84 | 91.3 | 108 | 86.4 | |
Present | 25 | 11.5 | 8 | 8.7 | 17 | 13.6 | |
Nutritional risk | 0.451 | ||||||
Absent | 183 | 84.3 | 80 | 87.0 | 103 | 82.4 | |
Present | 34 | 15.7 | 12 | 13.0 | 22 | 17.6 | |
x̄ ± SD | x̄ ± SD | x̄ ± SD | |||||
Age (year) | 75.17±13.25 | 77.46±12.25 | 73.48±13.74 | 0.029 | |||
CRP (mg/dL) | 115.45±74.62 | 112.16±63.58 | 117.87±81.96 | 0.564 | |||
Length of Stay (days) | 9.34±9.42 | 12.92±10.84 | 6.70±7.18 | <0.001 | |||
Cost (USD) | $544.34±730.84 | $743.43±957.93 | $397.81±453.81 | 0.002 | |||
Daily cost (USD/day) | $5.77±1.07 | $6.16±1.00 | $5.49±1.03 | <0.001 | |||
Data are presented as mean ± SD for continuous variables and n (%) for categorical variables. EN: Enteral nutrition, PN: Parenteral nutrition, CRP: C-reactive protein, USD: United States dollar, SD: Standard deviation
Bivariate associations between key variables and cost are shown in . Age, sex, diabetes status, and CRP were not significantly associated with cost (all p>0.05). LOS showed a significant positive correlation with cost (r=0.504; p<0.001). Costs also differed significantly by nutritional route, with higher unadjusted costs observed in the EN group (t=4.798; p<0.01), whereas no significant differences were observed by nutritional risk (p=0.380).
presents the regression and covariance models that examine predictors of hospitalization costs. Across all models, LOS was the strongest and most consistent predictor of cost. In the basic regression model, after adjustment for age, sex, CRP, diabetes, and nutritional risk, LOS remained positively associated with cost (B=0.072; p=0.001). The nutritional route was significantly associated with cost in the opposite direction to that observed in the unadjusted analysis, and EN was associated with lower cost levels (B=-0.246; p=0.038). Age, sex, CRP, diabetes, and nutritional risk were not statistically significant predictors in this model, which explained 46.1% of the variance in cost (R2=0.461).
Table 2. Findings related to the base and alternative models
Variables | SS | df | F | p | η2 | B | SE | t | p | 95% CI | Model findings |
|---|---|---|---|---|---|---|---|---|---|---|---|
Basic model | |||||||||||
Age (year) | 0.032 | 1 | 0.050 | 0.823 | 0.000 | 0.001 | 0.004 | 0.224 | 0.823 | -0.008-0.010 | R2: 0.461 Adjusted R2: 0.443 F: 25.575 (p<0.001) |
CRP (mg/dL) | 2.337 | 1 | 3.682 | 0.056 | 0.017 | 0.001 | 0.001 | 1.919 | 0.056 | 0.000-0.003 | |
Length of stay (days) | 86.144 | 1 | 135.736 | <0.001 | 0.394 | 0.072 | 0.006 | 11.651 | <0.001 | 0.060-0.085 | |
Gender (Female) | 0.872 | 1 | 1.374 | 0.243 | 0.007 | 0.136 | 0.116 | 1.172 | 0.243 | -0.093-0.365 | |
Diabetes (absent) | 0.039 | 1 | 0.061 | 0.805 | 0.000 | 0.043 | 0.173 | 0.247 | 0.805 | -0.299-0.385 | |
Route of nutritional support (EN) | 2.766 | 1 | 4.358 | 0.038 | 0.020 | -0.246 | 0.118 | -2.088 | 0.038 | -0.478-(-0.014) | |
Nutrition risk (absent) | 0.060 | 1 | 0.094 | 0.760 | 0.000 | 0.047 | 0.153 | 0.306 | 0.760 | -0.254-0.347 | |
Alternative model 1 | |||||||||||
Age (year) | 0.019 | 1 | 0.030 | 0.863 | 0.000 | 0.001 | 0.004 | 0.173 | 0.863 | -0.008-0.009 | R2: 0.476 Adjusted R2: 0.456 F: 23.613 (p<0.001) |
CRP (mg/dL) | 2.085 | 1 | 3.360 | 0.068 | 0.016 | 0.001 | 0.001 | 1.833 | 0.068 | 0.000-0.003 | |
Length of stay (days) | 89.393 | 1 | 144.077 | <0.001 | 0.409 | 0.092 | 0.010 | 9.134 | <0.001 | 0.072-0.111 | |
Gender (female) | 1.052 | 1 | 1.696 | 0.194 | 0.008 | 0.150 | 0.115 | 1.302 | 0.194 | -0.077-0.376 | |
Diabetes (absent) | 0.010 | 1 | 0.017 | 0.898 | 0.000 | 0.022 | 0.172 | 0.129 | 0.898 | -0.317-0.361 | |
Route of nutritional support (EN) | 6.313 | 1 | 10.176 | 0.002 | 0.047 | ||||||
EN | 0.502 | 0.161 | 3.118 | 0.002 | 0.185-0.819 | ||||||
PN | 0a | ||||||||||
Nutrition risk (absent) | 0.076 | 1 | 0.123 | 0.726 | 0.001 | 0.053 | 0.151 | 0.351 | 0.726 | -0.244-0.350 | |
Length of stay (days)× Route of nutritional support | 3.588 | 1 | 5.782 | 0.017 | 0.027 | ||||||
Length of stay (days)× Route of nutritional support (EN) | -0.030 | 0.013 | -2.405 | 0.017 | -0.005-0.027 | ||||||
Length of stay (days)× Route of nutritional support (PN) | 0a | ||||||||||
Alternative model 2 | |||||||||||
Age (year) | 0.003 | 1 | 0.004 | 0.949 | 0.000 | 0.000 | 0.004 | -0.064 | 0.949 | -0.009-0.008 | R2: 0.478 Adjusted R2: 0.458 F: 23.805 (p<0.001) |
CRP (mg/dL) | 2.503 | 1 | 4.050 | 0.045 | 0.019 | 0.001 | 0.001 | 2.012 | 0.045 | 2.97E-5-0.003 | |
Length of stay (days) | 43.729 | 1 | 70.753 | <0.001 | 0.254 | 0.127 | 0.022 | 5.745 | <0.001 | 0.084-0.171 | |
Gender (female) | 0.715 | 1 | 1.156 | 0.283 | 0.006 | 0.123 | 0.115 | 1.075 | 0.283 | -0.103-0.349 | |
Diabetes (absent) | 0.059 | 1 | 0.095 | 0.758 | 0.000 | 0.053 | 0.171 | 0.309 | 0.758 | -0.285-0.390 | |
Route of nutritional support (EN) | 2.636 | 1 | 4.266 | 0.040 | 0.020 | -0.240 | 0.116 | -2.065 | 0.040 | -0.469-(-0.011) | |
Nutrition risk (absent) | 1.603 | 1 | 2.593 | 0.109 | 0.012 | ||||||
Absent | 0.345 | 0.214 | 1.610 | 0.109 | -0.077-0.767 | ||||||
Present | 0a | ||||||||||
Length of stay (days)× Nutrition risk | 4.086 | 1 | 6.611 | 0.011 | 0.031 | ||||||
Length of stay (days)× Nutrition risk (absent) | -0.059 | 0.023 | -2.571 | 0.011 | -0.103-(-0.031) | ||||||
Length of stay (days)× Nutrition risk (present) | 0a | ||||||||||
Alternative model 3 | |||||||||||
Age (year) | 0.003 | 1 | 0.004 | 0.947 | 0.000 | 0.000 | 0.004 | -0.066 | 0.947 | -0.009-0.008 | R2: 0.488 Adjusted R2: 0.463 F: 19.647 (p<0.001) |
CRP (mg/dL) | 2.247 | 1 | 3.673 | 0.057 | 0.018 | 0.001 | 0.001 | 1.917 | 0.057 | -3.987-0.003 | |
Length of stay (days) | 43.598 | 1 | 71.254 | <0.001 | 0.257 | 0.131 | 0.028 | 4.749 | <0.001 | 0.077-0.186 | |
Gender (female) | 0.840 | 1 | 1.373 | 0.243 | 0.007 | 0.134 | 0.115 | 1.172 | 0.243 | -0.092-0.360 | |
Diabetes (absent) | 0.024 | 1 | 0.039 | 0.844 | 0.000 | 0.034 | 0.171 | 0.197 | 0.844 | -0.303-0.370 | R2: 0.488 Adjusted R2: 0.463 F: 19.647 (p<0.001) |
Route of nutritional support (EN) | 4.872 | 1 | 7.962 | 0.005 | 0.037 | ||||||
EN | 0.463 | 0.164 | 2.822 | 0.005 | 0.140-0.787 | ||||||
PN | 0a | ||||||||||
Nutrition risk (absent) | 1.055 | 1 | 1.724 | 0.191 | 0.008 | ||||||
Absent | 0.283 | 0.215 | 1.313 | 0.191 | -0.142-0.708 | ||||||
Present | 0a | ||||||||||
Length of stay (days)× Route of nutritional support× Nutrition risk | 6.597 | 3 | 3.594 | 0.015 | 0.050 | ||||||
Length of stay (days)× Route of nutritional support (EN)× Nutrition risk (absent) | -0.071 | 0.029 | -2.454 | 0.015 | -0.129-(-0.014) | ||||||
Length of stay (days)× Route of nutritional support (EN)× Nutrition risk (present) | -0.017 | 0.033 | -0.522 | 0.602 | -0.082-0.047 | ||||||
Length of stay (days)× Route of nutritional support (PN)× Nutrition risk (absent) | -0.046 | 0.029 | -1.577 | 0.116 | -0.103-0.011 | ||||||
Length of stay (days)× Route of nutritional support (PN)× Nutrition risk (present) | 0a | ||||||||||
aReference category Hospitalization costs were analyzed using a general linear model (univariate analysis of covariance, ANCOVA) with Type III sum of squares. For categorical variables, the reference category is indicated as “0ᵃ,” and its coefficient is fixed at zero by definition. Statistical significance was set at p<0.05. The basic model was estimated using linear regression; alternative Models 1-3 were estimated using analysis of covariance (ANCOVA, Type III sum of squares) to evaluate interaction effects between length of stay and nutritional approach. The outcome variable (total hospital cost) was log-transformed prior to analysis due to significant positive skewness. For categorical variables, the reference category is indicated as “0ᵃ,” with its coefficient fixed at zero by definition. The first p-value (adjacent to F) reflects the overall (Type III) test of the variable’s effect; the second p-value (adjacent to t) reflects the significance of the individual regression coefficient (B). Statistical significance was set at p<0.05. SS: Sum of squares, df: Degrees of freedom, F: F Statistic, η2: Partial eta squared, B: Unstandardized regression coefficient, SE: Standard error, t: t statistic, CI: Confidence interval, R2: Coefficient of determination, CRP: C-reactive protein, EN: Enteral nutrition, PN: Parenteral nutrition, ×: denotes the interaction term between the variables
The interaction models showed that the association between LOS and cost differed according to nutritional route and nutritional risk. The LOS × EN interaction was significant (B=-0.030; p=0.017), indicating that the marginal increase in cost associated with LOS was smaller among EN patients (Alternative Model 1). Similarly, the LOS × absence-of-nutritional-risk interaction was significant (B=-0.059; p=0.011), and CRP also reached significance in this model (B=0.019; p=0.045) (Alternative Model 2). The three-way interaction (LOS × EN × no nutritional risk) was significant in Alternative Model 3 (B=-0.071; p=0.015), identifying the smallest marginal cost increase among patients receiving EN without nutritional risk, and this model showed the best overall fit (R2=0.488).
Discussion
This study investigated how nutritional route and nutritional risk shape hospitalization costs in C-ICU patients, with particular attention to their interaction with LOS. Across all models, LOS emerged as the dominant cost driver. However, the interaction analyses showed that the association between LOS and cost was not uniform but varied according to nutritional route and nutritional risk. This constitutes the central contribution of the study: that the nutritional route and nutritional risk modify the marginal cost of prolonged hospitalization, revealing a pattern not consistently captured by main-effects-only analyses in prior research. This gap is particularly relevant for the C-ICU setting, where a recent review highlighted a lack of robust evidence regarding appropriate nutritional support despite the high prevalence of malnutrition and its adverse impact on prognosis in acute heart failure, acute coronary syndrome, cardiogenic shock, and post-cardiac arrest patients ().
The interaction between EN and LOS indicated that EN was associated with a smaller incremental increase in costs as hospitalization lengthened. This pattern may reflect differences in clinical characteristics and resource utilization between patients receiving EN and PN. Factors such as clinical stabilization, infection-related complications, and the use of high-cost interventions may contribute to these differences; however, these factors were not directly assessed in this study, and residual and unmeasured confounding cannot be excluded. In contrast, PN is typically administered to clinically unstable patients and is associated with risks-such as catheter-related infections and metabolic disturbances-that may help explain the steeper cost trajectory observed with longer PN-associated admissions. Notably, current guidance for this specific population cautions that EN in hemodynamically unstable patients carries a low but recognized risk of intestinal ischemia, which likely contributes to clinicians’ preference for PN in the most unstable patients ()-a pattern directly consistent with the confounding by indication discussed below.
Similarly, the interaction between LOS and nutritional risk indicated that patients without nutritional risk had smaller marginal cost increases during extended hospitalization. This pattern is consistent with a large C-ICU cohort study, in which a higher risk of malnutrition assessed by the geriatric nutritional risk index was significantly linked to increased in-hospital mortality, as well as longer hospital stay and C-ICU stay, compared with patients at no nutritional risk (). That study’s use of subgroup interaction analyses-finding significant interactions between nutritional status and mortality across hypertension, arrhythmia, cardiac arrest, shock, and chronic kidney disease subgroups-lends further methodological support to an interaction-based rather than a main-effects-only approach to modeling nutritional risk in C-ICU populations, consistent with the analytic strategy adopted here. These findings should be situated within, but not simply mapped onto, the existing literature. A recent meta-analysis of 14 studies found that early EN was associated with modest reductions in ICU and hospital LOS (mean differences of 0.18 and 1.15 days, respectively) and fewer bloodstream infections compared with early PN (). Our finding of a significant LOS × nutritional route interaction, rather than a comparably small main effect, suggests one possible explanation for the modest pooled estimate: if the cost and LOS advantage of EN are not constant but increase with duration of hospitalization, then studies that report only average effects across heterogeneous LOS distributions may understate its clinical and economic relevance for patients with prolonged stays. This interaction-based perspective may offer a more informative lens than reliance on main effects alone when evaluating nutritional routes in future cost analyses.
A systematic study demonstrated that withholding early PN reduced infections and accelerated recovery from organ failure, translating into shorter hospitalization and lower costs (), and a cost-effectiveness analysis similarly concluded that early PN increased costs without improving outcomes relative to EN (). These findings support the plausibility of a genuine, mechanism-driven cost advantage for EN. However, because these studies remove the influence of baseline illness severity on treatment assignment-precisely the factor our observational design could not fully account for-these trials cannot confirm that the magnitude of the association observed in our cohort reflects treatment effect alone. It is more likely that our findings reflect a combination of a modest treatment-related effect and a selection-driven component due to confounding by indication (discussed below); the relative contribution of each cannot be disentangled using the present data. Current guidelines recommending EN within the first 48 hours (-) further support the physiological rationale for early EN, though guideline endorsement reflects evidence from controlled settings that may not fully generalize to the heterogeneity of routine C-ICU practice.
The relatively low prevalence of nutritional risk in this cohort (15.7%) also warrants comment, as it is notably lower than rates reported in other ICU and cardiac surgery populations. While rates of NRS-2002-defined risk reported in general ICU and cardiac surgery populations are often considerably higher (approximately 40-46%) (,), a more directly comparable population-patients with acute coronary syndrome-shows a pattern more consistent with our findings. In a large retrospective study, NRS ≥3 was present in only 6% of survivors, compared with 20% of those who died in hospital (), indicating that nutritional risk by this definition is comparatively uncommon in these populations overall, though strongly associated with mortality when present. Given that survivors substantially outnumber non-survivors in most C-ICU cohorts, including ours, a population-wide prevalence in the range of 15-20% is plausible for this specific patient group and does not need to be solely attributable to incomplete NRS-2002 documentation, as previously suggested. This distinction matters clinically: even at low prevalence, nutritional risk identified by NRS-2002 appears to carry meaningful prognostic weight in these populations and, by extension, in C-ICU patients, reinforcing the value of systematic screening despite its low positive rate in these populations.
These associations must be interpreted with caution, given the observational and non-randomized nature of assignment to nutritional routes. In routine clinical practice, the decision to initiate EN versus PN is guided by the patient’s clinical status rather than made independently of it: patients who are hemodynamically unstable, have gastrointestinal contraindications, or are otherwise more severely ill are more likely to receive PN, whereas clinically stable patients are more likely to receive EN. This selection pattern aligns with current clinical guidance for this population, which recommends EN over PN as a general principle while explicitly acknowledging the elevated-if low absolute-risk of intestinal ischemia with EN in hemodynamically unstable patients, alongside preference for hypocaloric intake in the first week of ICU admission and vigilance for refeeding syndrome in malnourished patients (). These are precisely the clinical considerations that would have guided route selection in our cohort but could not be captured by the covariates available in this study. Notably, the unadjusted analysis showed higher costs in the EN group, whereas the adjusted models showed the opposite: EN was associated with lower costs. This reversal of direction after adjustment is itself consistent with confounding by indication: it suggests that unadjusted comparisons may have been dominated by baseline differences in illness severity between groups and that even the adjusted estimate should be interpreted cautiously, since the covariates available (age, sex, CRP, diabetes, and LOS) may not fully capture the clinical basis on which the nutritional route was chosen. In particular, the models did not include several variables known to jointly influence both nutritional route selection and hospitalization cost, including validated severity-of-illness scores (APACHE II/IV, SOFA, SAPS II), indicators of organ support and hemodynamic instability (mechanical ventilation, vasopressor use), cardiac functional status (e.g., ejection fraction), primary admission diagnosis (e.g., myocardial infarction, heart failure, arrhythmia), and overall comorbidity burden (Charlson Comorbidity Index). The absence of these variables substantially raises the risk of residual confounding, as patients selected for PN are likely to differ systematically from those selected for EN on these dimensions. Consequently, the observed associations between the nutritional route and cost, including interaction effects with LOS, may partly reflect underlying differences in patient acuity and diagnoses that were not fully captured in the available data and should therefore not be interpreted as causal effects of the nutritional approach. While the consistency of this pattern across multiple models and its partial alignment with mechanistic evidence from randomized trials lend some support to a genuine association, the possibility that residual confounding accounts for part or all of the observed effect cannot be excluded. Future studies incorporating these severity and diagnostic indicators, along with propensity score-based methods, would help clarify the extent to which this association reflects a treatment-related effect versus underlying patient selection.
The findings of this study should be interpreted within the context of the SSI perspective. Unlike studies conducted from hospital, societal, or healthcare system perspectives, the cost estimates in the present study were based on standardized SSI reimbursement payments rather than on actual hospital expenditures or resource consumption. Therefore, differences in absolute cost values compared with those reported in the international literature are expected, primarily reflecting variations in reimbursement policies, healthcare financing systems, costing methodologies, and country-specific pricing structures. Nevertheless, the observed associations between nutritional approach, nutritional risk, LOS, and hospital costs remain clinically and economically relevant, as they provide insight into the relationships among these factors within the Turkish reimbursement system and may inform future reimbursement policies and resource allocation decisions.
Together, these findings suggest that the cost implications of nutritional support cannot be understood solely through main effects. Instead, the nutritional route and nutritional risk appear to interact with LOS in clinically relevant ways, shaping observed patterns of resource utilization. For clinicians, these associations may support the value of systematic nutritional risk assessment and consideration of EN in eligible patients, when clinically appropriate, in line with existing guidelines, while recognizing that individual clinical judgment regarding EN feasibility must remain paramount. For managers and policymakers, strategies that support EN availability, promote guideline adherence, and integrate nutritional screening into routine ICU protocols may be worth further evaluation as potential approaches to managing ICU expenditures, pending confirmation in studies better able to account for illness severity. While variables such as age, sex, CRP, and diabetes showed limited direct associations, the interplay between nutritional approach and LOS emerged as the most clinically relevant correlate of cost in this cohort. These findings are hypothesis-generating and suggest that EN-particularly in patients without nutritional risk-warrants further prospective investigation, ideally incorporating adjustment for severity or randomization, as a potential strategy for mitigating the economic burden of care in the coronary ICU.
Study Limitations
This study has several limitations that should be considered when interpreting the findings. Although the dataset included 217 C-ICU patients, incomplete information for some variables, particularly the absence of recorded NRS-2002 assessments, reduced analytical precision. This limitation reflects broader challenges in routine malnutrition screening and the integration of nutritional assessment tools into electronic medical record systems and calls for improved clinical documentation practices. Second, the categorization of patients into EN and PN groups restricted the evaluation of combined nutritional approaches. Because very few patients received simultaneous EN and PN, the study could not assess how hybrid nutrition strategies might influence LOS or costs. As combined approaches are increasingly used in modern ICU nutrition therapy, future research with more granular data is warranted. Third, the analysis relied on hospital-reported data, whose accuracy was assumed. Although this approach is standard in retrospective studies, it introduces potential risks related to documentation inconsistencies or coding variability. Fourth, perhaps most importantly, the allocation of patients to EN versus PN was not randomized but rather reflected clinical decision-making, introducing the possibility of confounding by indication. The multivariable models adjusted only for age, sex, CRP, diabetes, and LOS and did not include several clinically important variables known to influence both nutritional route selection and hospitalization cost. These include validated severity-of-illness scores (APACHE II/IV, SOFA, SAPS II), indicators of organ support and hemodynamic instability (mechanical ventilation, vasopressor use), cardiac functional status (ejection fraction or other measures of cardiac function), primary admission diagnosis (e.g., myocardial infarction, heart failure, arrhythmia), and overall comorbidity burden (Charlson Comorbidity Index). The absence of these variables substantially raises the risk of residual confounding, as patients selected for PN are likely to differ systematically from those selected for EN with respect to these dimensions, for example, greater illness severity, hemodynamic instability, or gastrointestinal contraindications to EN. Consequently, the observed associations between the nutritional route and cost, including the interaction effects with LOS, may partly reflect underlying differences in patient acuity and diagnoses that were not fully captured in the available data and therefore should not be interpreted as direct causal effects of the nutritional approach. Future studies should incorporate these severity and diagnostic indicators, along with propensity-score-based methods, to more rigorously isolate the contribution of the nutritional route from that of the underlying clinical status. Fifth, three separate covariance models were constructed to evaluate interaction effects involving LOS, nutritional route, and nutritional risk. No correction for multiple comparisons (e.g., Bonferroni or false discovery rate adjustment) was applied across these models, increasing the risk of Type I error. Although the models were built sequentially to address distinct, conceptually related questions rather than as independent hypothesis tests, applying a conservative correction would render the LOS × EN interaction in Alternative model 1 (p=0.017) marginally non-significant, whereas the interactions in Alternative Models 2 and 3 would remain significant. Future studies should consider formal multiplicity adjustment or preregistered analysis plans to more rigorously control for this risk. Sixth, because this was a retrospective study encompassing all eligible patients during the predefined study period, an a priori sample size calculation was not performed. A sensitivity analysis indicated that relatively small effects (f2≥0.0365) could be detected with 80% power, suggesting that the available sample was adequate for evaluating the proposed relationships; nonetheless, the absence of prospective power planning should be acknowledged as a methodological limitation.
Taken together, these limitations should be considered when interpreting the findings but do not diminish the study’s overall contribution. Instead, they highlight important directions for improving data quality and for guiding future research on nutritional strategies in C-ICU settings. Despite these limitations, the present study has several important strengths. It is one of the few studies to simultaneously evaluate the nutritional route, nutritional risk, and their interaction with LOS with respect to hospital costs among coronary ICU patients. Furthermore, it used detailed patient-level electronic health records collected over five years and applied multivariable statistical models to adjust for key clinical confounders, thereby providing a comprehensive assessment of the economic implications of nutritional management in routine clinical practice.
Conclusion
The present study demonstrated that EN was associated with lower hospital costs during prolonged C-ICU stays, particularly among patients who underwent systematic nutritional risk assessment. These findings suggest that incorporating nutritional risk screening into nutritional management and considering EN as a nutritional support strategy may contribute to more efficient resource utilization; however, given the observational design and the potential for residual confounding, a causal interpretation of these findings is not warranted. Prospective multicenter studies are needed to evaluate standardized EN protocols and their associated clinical and economic outcomes.
Ethics
Ethics Committee Approval: Ethical approval was obtained from the Izmir Katip Celebi University Social Research Ethics Committee (approval number: 2025/24-07, date: 10.12.2025).
Informed Consent: This study was designed as a retrospective observational study using routinely collected electronic health records. Patient data were obtained from hospital records, with no intervention in clinical decision-making or alteration of patients’ nutritional management. This design enabled the assessment of associations between nutritional support strategies, nutritional risk status, length of hospital stay, and total hospital costs within the context of routine clinical practice. Informed consent was not obtained from the patients due to the retrospective nature of the study.
Footnotes
Authorship Contributions
Concept: C.A., H.D., Design: C.A., H.D., Data Collection or Processing: C.A., H.D., T.A., S.M., Analysis or Interpretation: C.A., H.D., T.A., S.M., Literature Search: C.A., H.D., Writing: C.A., H.D.
Conflict of Interest
The authors declared that there were no conflicts of interest.
Financial Disclosure
The authors declared that this study received no financial support.
Declaration Regarding the Use of AI and AI-Assisted Technologies: Artificial intelligence-assisted tools were used for language editing, manuscript formatting, table preparation, and literature checking. All outputs were reviewed and verified by the authors. The authors take full responsibility for the content of the manuscript, the accuracy of the data, and the integrity of the work.
References
Ediboğlu Ö, Moçin ÖY, Özyılmaz E, et al. Current statement of intensive care units in Turkey: data obtained from 67 centers. Turk Thorac J. 2018;19:209-15.
Lew CCH, Yandell R, Fraser RJL, Chua AP, Chong MFF, Miller M. Association between malnutrition and clinical outcomes in the intensive care unit: a systematic review. JPEN J Parenter Enteral Nutr. 2017;41:744-58.
Moghaddam OM, Hosseinzadeh Emam M, Irandoost P, et al. Relation between nutritional status on clinical outcomes of critically ill patients: emphasizing nutritional screening tools in a prospective cohort investigation. BMC Nutrition. 2024;10:69.
Xu J, Luo D, Chi R, et al. Comparison between the NUTRIC score and modified NUTRIC score to predict hospital mortality in patients undergoing cardiac surgery: a retrospective study. Nutr Clin Pract. 2026;41:166-76.
Brisard L, Le Gouge A, Lascarrou JB, et al. Impact of early enteral versus parenteral nutrition on mortality in patients requiring mechanical ventilation and catecholamines: study protocol for a randomized controlled trial (NUTRIREA-2).Trials. 2014;15:507.
Ido T, Hayashi T, Yamada T, Nakamoto K, Sotomi Y, Higuchi Y. Implementation of an enteral nutrition protocol in the cardiac care unit- a retrospective study of critically Ill cardiovascular patients. Circ Rep. 2025;8:127-35.
Yeh DD. Fueling recovery: evidence-based ICU nutrition and immunonutrition strategies in 2026. Trauma Surgery Acute Care Open. 2026;11:e002284.
Reignier J, Gaillard-Le Roux B, Dequin PF, et al. Expert consensus-based clinical practice guidelines for nutritional support in the intensive care unit: the French Intensive Care Society (SRLF) and the French-Speaking Group of Pediatric Emergency Physicians and Intensivists (GFRUP). Ann Intensive Care. 2025;15:99.
Alsharif DJ, Alsharif FJ, Aljuraiban GS, Abulmeaty MMA. Effect of supplemental parenteral nutrition versus enteral nutrition alone on clinical outcomes in critically ill adult patients: a systematic review and meta-analysis of randomized controlled trials. Nutrients. 2020;12:2968.
Blaser AR, Thibault R, Bachmann KF. Parenteral nutrition in the ICU. Clinical Nutrition Open Science. 2026;66:100635.
Kalın BS, Altun K, Sert Aİ, Kurt Çelebi N, Aktiz Bıçak E, Savuşma B. Investigation of the effect of the modified nutrition risk in critically ill score on the length of stay in the intensive care unit. Clin Sci Nutr. 2023;5:58-62.
R Core Team. R: a language and environment for statistical computing. Vienna (Austria): R Foundation for Statistical Computing; 2025.
Alpar R. Uygulamalı çok değişkenli istatistiksel yöntemler. 4. Baskı. Ankara: Detay Yayıncılık; 2013.
Popiołek-Kalisz J, Chromiński T, Szczasny M, Błaszczyk P. Nutritional status predicts the length of stay and mortality in patients undergoing electrotherapy procedures. Nutrients. 2024;16:843.
Alpar R. Spor, sağlık ve eğitim bilimlerinden örneklerle uygulamalı istatistik ve geçerlik-güvenirlik. 4. Baskı. Ankara: Detay Yayıncılık; 2016.
Gürbüz S, Şahin F. Sosyal bilimlerde araştırma yöntemleri. Ankara: Seçkin Yayıncılık; 2014.
Crawley MJ. The R book. England: Wiley Publications; 2009.
IBM Corp. IBM SPSS Statistics for Windows (Version 25.0)[Computer software]. IBM Corp; 2017. Available from: https://www.ibm.com/products/spss-statistics
OpenAI. Notebook LM [large language model]. OpenAI; 2025. Available from: https://notebooklm.google.com
OpenAI. ChatGPT (version 4) [AI model]. OpenAI; 2025. Available from: https://chat.openai.com
Anthropic. Claude AI (version 1.0) [AI language model]. Anthropic; 2025. Available from: https://claude.ai
Frederiks P, Peetermans M, Wilmer A. Nutritional support in the cardiac intensive care unit. Eur Heart J Acute Cardiovasc Care. 2024;13:373-9.
Li Y, Wang Z, Sun T, Zhang B, Liang X. Geriatric nutritional risk index was associated with in-hospital mortality among cardiac intensive care unit patients. Front Nutr. 2023;10:1218738.
Zhang G, Zhang K, Cui W, Hong Y, Zhang Z. The effect of enteral versus parenteral nutrition for critically ill patients: a systematic review and meta-analysis. JJ Clin Anesth. 2018;51:62-92.
Shi J, Wei L, Huang R, Liao L. Effect of combined parenteral and enteral nutrition versus enteral nutrition alone for critically ill patients: a systematic review and meta-analysis. Medicine. 2018;97:e11874.
Pradelli L, Graf S, Pichard C, Berger MM. Supplemental parenteral nutrition in intensive care patients: a cost-saving strategy. Clin Nutr. 2018;37:573-9.
Singer P, Blaser AR, Berger MM, et al. ESPEN practical and partially revised guideline: clinical nutrition in the intensive care unit. Clin Nutr. 2023;42:1671-89.
Reintam Blaser A, Starkopf J, Alhazzani W, et al. Early enteral nutrition in critically ill patients: ESICM clinical practice guidelines. Intensive Care Med. 2017;43:380-98.
Doğanay M, Akçay K, Çil T, et al. KEPAN enteral beslenme rehberi. Clin Sci Nutr. 2023;5:1-29.
Klek S, Szybinski P, Szczepanek K. Perioperative immunonutrition in surgical cancer patients: a summary of a decade of research. World J Surg. 2014;38:803-12.
Yang WB, Zhang W, Zhang JF, Yang TY, Mo ZF. Effect of supplementary parenteral nutrition on glucose and lipid metabolisms, risk of infection, and prognosis in critically ill patients with low body weight. Dig Med Res. 2019;2:10.
Czapla M, Karniej P, Juárez-Vela R, Łokieć K. The association between nutritional status and in-hospital mortality among patients with acute coronary syndrome-a result of the Retrospective Nutritional Status Heart Study (NSHS). Nutrients. 2020;12:3091.