
Abstract
Aim
Temporal muscle thickness (TMT) has shown inconsistent prognostic utility in chronic subdural hematoma (cSDH). This study evaluated whether TMT independently predicted survival among surgically treated patients with cSDH while controlling for established clinical markers.
Methods
This is a 10-year single-center retrospective cohort study (2013-2023) that analyzed 105 patients aged ≥18 years who underwent surgical cSDH drainage at a tertiary center. Two independent neurosurgeons measured TMT on preoperative computed tomography scans, demonstrating excellent interrater reliability (intraclass correlation coefficients >0.9). TMT was adjusted for age and sex using linear regression in our cohort. Multivariate Cox regression identified independent predictors of mortality while controlling for traditional clinical markers.
Results
The mean age was 69.6±14.4 years with a mean TMT of 5.6±1.6 mm. Survival rates were 96.2% at 3 months and 63.7% at 60 months. In multivariate analysis, independent predictors of mortality included age [hazard ratio (HR)=1.06, p<0.005], albumin levels (HR=0.92, p=0.05; p=0.03 in the model without TMT), keyhole surgical technique (HR=0.18, p<0.005), living status (HR=2.58, p=0.04), and bilateral hematomas (HR=3.23, p=0.02). Temporal muscle thickness was not an independent predictor (HR=0.94, p=0.61).
Conclusion
TMT does not independently predict cSDH survival when traditional clinical markers are considered. Age, albumin levels, surgical technique, living status, and hematoma laterality remain stronger prognostic determinants than TMT alone.
Keywords: Chronic subdural hematoma, survival analysis, temporal muscle, prognosis
Introduction
Chronic subdural hematoma (cSDH) is among the most frequently encountered neurosurgical conditions worldwide. A recent systematic review of the global literature, covering 18 studies across 12 countries and five continents, reported clinical and surgical incidence rates ranging from 3.39 to 39.1 per 100,000 person-years, with incidence rising up to threefold among patients over 80 years of age; notably, no reliable prevalence data currently exist (). Its incidence continues to increase alongside global population aging, placing increasing demands on neurosurgical services (). Historically, cSDH has been associated with significant mortality rates, ranging from 9 to 33%, depending on patient characteristics and treatment modalities (). Several established predictors of poor outcomes in cSDH have been identified, including advanced age, comorbidity burden (), anticoagulant use, initial neurological status, and radiographic features such as hematoma volume and midline shift (). Recently, there has been more interest in using measures of patient frailty as possible prognostic indicators. For example, temporal muscle thickness (TMT) for sarcopenia has become a crucial marker in neurosurgical populations (-). Its availability on standard cranial computed tomography (CT) imaging, without extra radiation exposure or special protocols, makes it a viable choice for opportunistic prognostic assessment. The recent multidisciplinary guideline for cSDH care emphasizes frailty-informed risk stratification throughout the patient pathway, yet recommends no imaging-based sarcopenia marker for prognostication ().
However, evidence regarding TMT’s prognostic utility in cSDH remains inconsistent. Korhonen et al. () reported that reduced TMT independently predicted shorter survival in patients with cSDH, proposing sex-specific cut-off values for mortality risk stratification. Dubinski et al. () associated reduced TMT with poorer functional outcomes but did not address long-term survival. Du et al. () raised important methodological concerns regarding these findings, questioning whether TMT alone provides sufficient frailty assessment without incorporating additional body composition metrics or controlling for surgical variables. These discrepancies raise important questions about whether TMT provides independent prognostic information beyond established clinical markers. We hypothesized that TMT would not independently predict mortality among surgically treated cSDH patients, even after adequate adjustment for traditional clinical and radiological variables.
In this study, we present our 10-year retrospective review evaluating TMT as a prognostic marker in patients undergoing surgical drainage for cSDH. We sought to determine whether TMT independently predicts mortality, even after adjustment for established clinical parameters, including previously unexamined influences of surgical technique and hematoma laterality. We assessed whether post-operative changes in TMT provided additional prognostic information beyond baseline measurements. By addressing these questions, we aim to refine our understanding of TMT’s role in cSDH outcomes and support more targeted patient risk stratification.
Materials and Methods
Compliance with Ethical Standards
Ethical approval was obtained from the Ege University Ethics Committee (approval number: 24-3T/34, date: 07.03.2024). The patients’ consent to participate was obtained using the ethics committee-approved form. This study was conducted in accordance with the ethical standards outlined in the 1964 Declaration of Helsinki and its subsequent amendments.
Study Design
This retrospective cohort study evaluated patients aged 18 years or older who underwent surgical drainage for cSDH at the Department of Neurosurgery, Ege University Faculty of Medicine, between January 2013 and January 2023. This time frame was chosen to ensure a minimum follow-up period of two years and to coincide with the full implementation of our electronic recording system in 2013. The patient selection flowchart is shown in .
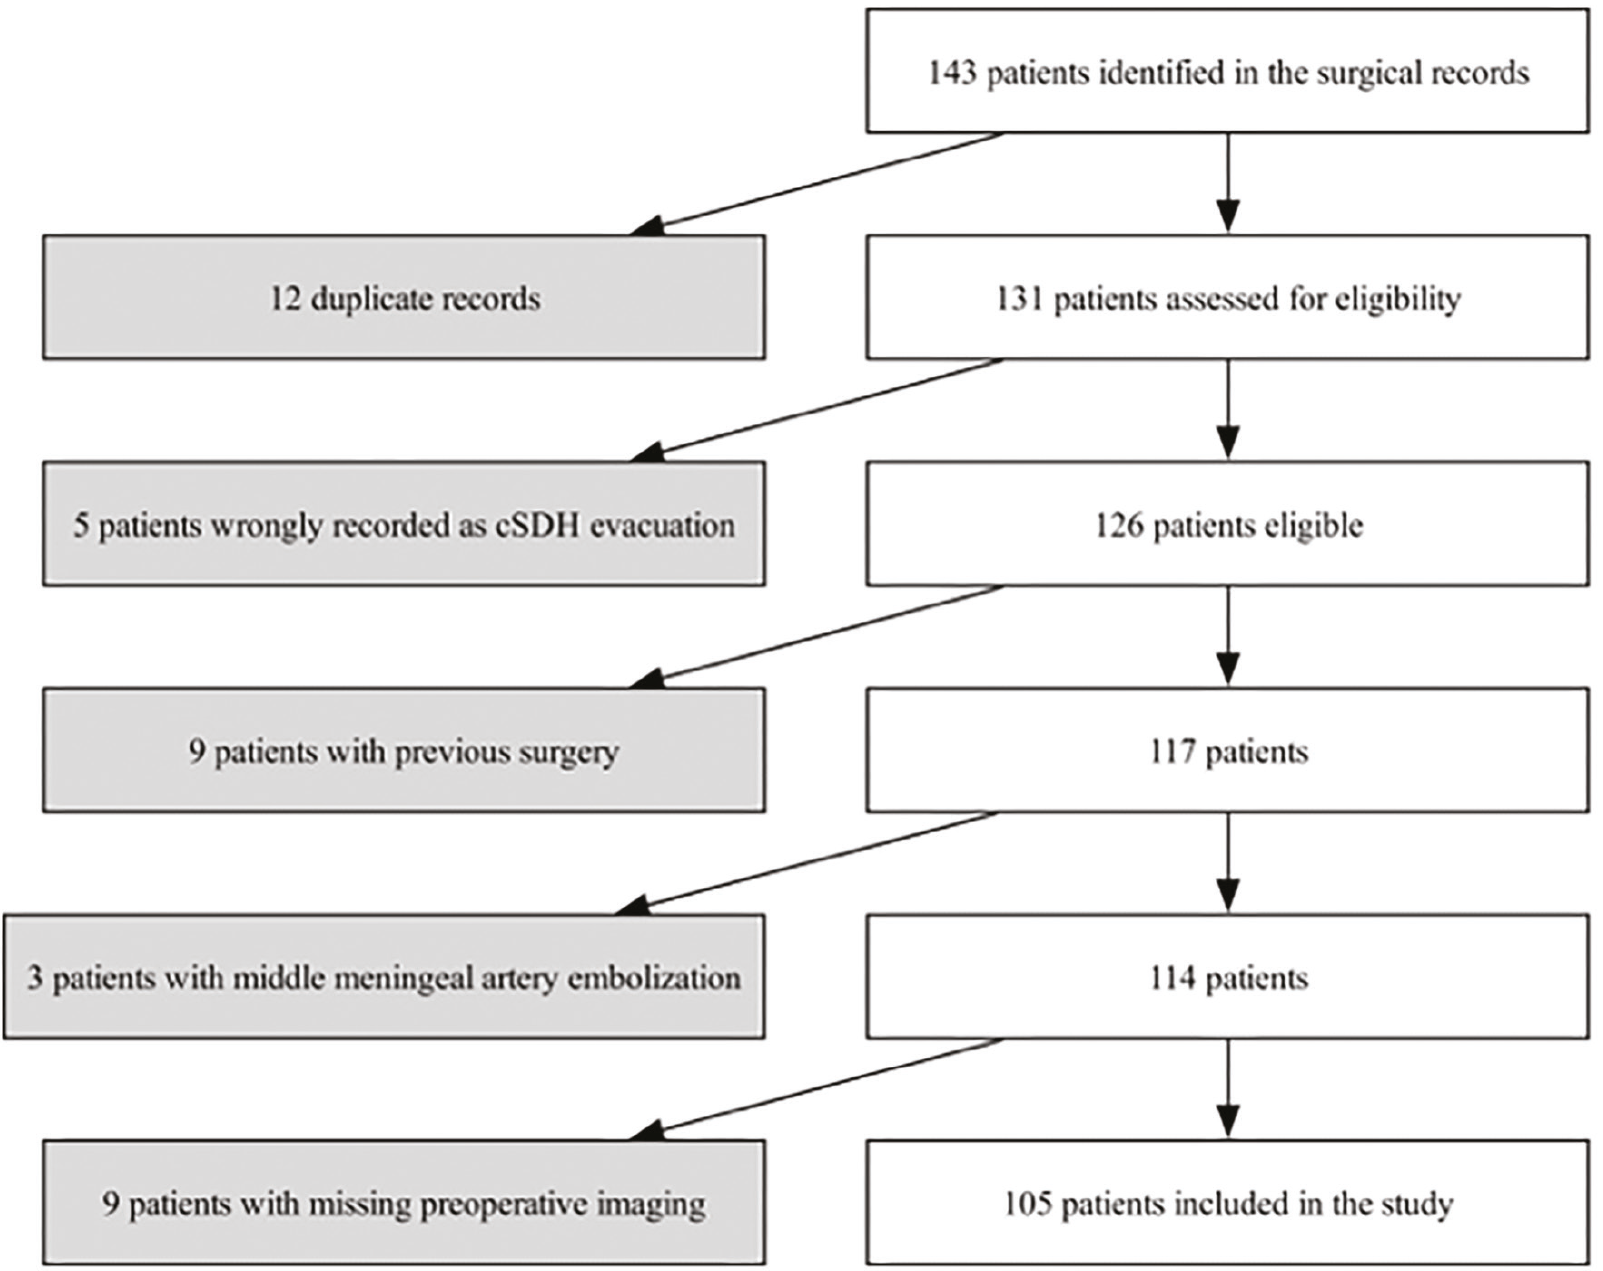
Patient selection flowchart
cSDH: Chronic subdural hematoma
Chronic subdural hematoma was diagnosed based on clinical presentation with neurological symptoms attributable to the subdural collection, combined with CT evidence of subdural fluid collection demonstrating >50% hypodense or isodense components consistent with chronicity, as per current diagnostic standards ().
Surgical intervention was indicated for symptomatic patients with cSDH thickness ≥10 mm on axial CT imaging. While midline shift was not an absolute criterion, its presence (particularly >5 mm) provided additional support for surgical decision-making. The final surgical decision was made by the attending neurosurgeon based on the combination of clinical symptoms, imaging findings, and the patient’s overall condition ().
Patients were included if they had a confirmed diagnosis of cSDH, based on the clinical and radiological criteria described above, and if preoperative and follow-up CT scans were available. Patients were excluded if they had undergone previous cranial surgery or had received middle meningeal artery embolization. Since death data were available from government registries, patients with incomplete clinical follow-up were still included in survival analyses.
Recurrence was defined as the clinical reappearance of neurological symptoms in a previously treated patient requiring repeat surgical intervention, as determined by the treating neurosurgeon. Asymptomatic radiological reaccumulation without clinical symptoms was not classified as recurrence, consistent with the clinical relevance-based approach to cSDH management ().
Clinical Variables
For each patient, we recorded the following clinical variables: age, sex, American Society of Anesthesiologists (ASA) score, preoperative modified Rankin Scale (mRS), side of the operated hematoma, surgical technique (categorized as burr hole or keyhole), length of hospital stay, living status (1: home-care for self, 2: home-with assistance, 3: institutionalized), and various laboratory parameters (including hemoglobin, leukocyte count, and albumin levels). Survival data, defined as the time from the date of surgery to death from any cause, were obtained from our institutional records and verified through national registries.
Surgical Technique
At our center, we employ a standardized surgical approach for cSDH drainage, with technique-specific variations. All procedures were performed under general anesthesia in the supine position. For double-burr hole procedures, two separate skin incisions were made, and two burr holes (14 mm diameter each) were created. For keyhole procedures, a single skin incision (approximately 3x3 cm) was made to perform a keyhole craniotomy. Each operated side was irrigated with a minimum of 1 liter of body-temperature 0.9% NaCl solution or until the effluent was clear. Irrigation pressure was standardized across both techniques. This practice, applied uniformly throughout the study period, is concordant with subsequent randomized evidence and current guideline recommendations favoring warmed irrigation fluid (,). The size of the craniotomy is shown in .
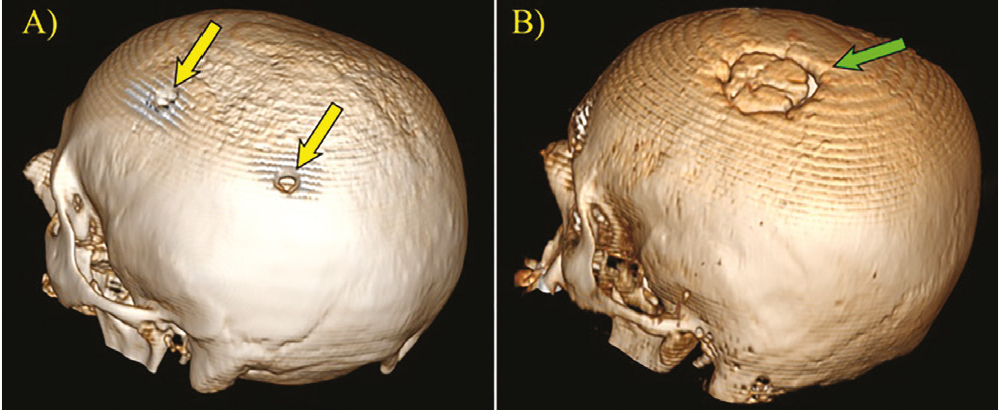
Three-dimensional CT reconstructions demonstrating postoperative skull appearances following the two surgical techniques used for chronic subdural hematoma drainage, viewed from the posterolateral perspective of the left side. (A) Burr hole craniotomy showing two small circular defects (yellow arrows). (B) Keyhole craniotomy demonstrating a larger oval craniotomy defect (green arrow), which allows wider surgical access and direct visualization of the subdural space
CT: Computed tomography
In double burr-hole procedures, flexible Penrose drains were placed and secured to the scalp, whereas keyhole surgeries used a closed subdural drainage system (Jackson-Pratt drain). Both techniques included standard closure, including galea suturing and skin approximation, and both drains were typically removed on postoperative days 2-3.
Selection of surgical technique was determined by the preferences of individual attending surgeons, with each surgeon using a consistent technique across their cases regardless of patient age, comorbidity burden, hematoma characteristics, or neurological status.
Temporal Muscle Thickness Measurement
Temporal muscle thickness was measured on preoperative CT scans and repeated on one-month postoperative control scans using the same technique described by Korhonen et al. () and Pesonen et al. (). Two neurosurgeons, blinded to patient outcomes, independently measured TMT on both the left and right sides; the mean of these bilateral measurements was then calculated and used for subsequent analysis.
Temporal muscle thickness categories were defined using a regression-based approach. Preoperative TMT was modelled by ordinary least-squares linear regression in our cohort, first with sex alone (sex-adjusted model) and then with age and sex (age- and sex-adjusted model). Patients whose measured TMT fell below the value predicted by the respective model were classified as “Thin” and those at or above it as “Thick” The sex-adjusted classified as “Thin,” and those at or above it as “Thick.” The sex-adjusted classification was used for the first Kaplan-Meier comparison, and the age- and sex-adjusted classification for the second Kaplan-Meier comparison, the cohort characteristics, and the recurrence analysis. Separately, following the methodology of Korhonen et al. (), sex-specific TMT cut-off values for predicting two-year mortality were determined using receiver operating characteristic curves by maximizing Youden’s index. These cut-offs are reported as exploratory and were not used to define Thin/Thick groups in any survival or recurrence analysis.
Statistical Analysis
Statistical analyses were performed using Python 3 (Spyder IDE 6.0.3) and specialized libraries, including Pandas, NumPy, SciPy, statsmodels, and lifelines. The relevant code and dataset can be found at “https://github.com/AkbulutBB/Statistics/tree/main/cSDHTMT.”
Descriptive statistics were computed for all continuous and categorical variables. Group comparisons were conducted using Student’s t-tests for continuous variables and chi-square or Fisher’s exact tests for categorical data. Kaplan-Meier survival analysis was employed to estimate survival probabilities at 3, 12, 24, and 60 months, and log-rank tests were used to compare survival curves between groups. Forest plots were generated to visually represent HR and confidence intervals from Cox proportional hazards models.
Multivariate Cox regression models were constructed to identify independent predictors of overall mortality and hematoma recurrence and to evaluate the prognostic impact of preoperative TMT (and its percent change at 1 month) and hematoma laterality, which was modeled categorically (right-sided hematomas as the reference). Candidate covariates were selected a priori on the basis of established clinical relevance and prior literature (age, sex, ASA score, albumin, living status, hematoma laterality, and surgical technique) and were supplemented by variables associated with mortality on univariate analysis (p<0.10). This combined clinical-statistical selection strategy was adopted to balance model parsimony against the limited number of observed events. Additionally, linear regression analyses were performed to assess predictors of TMT (adjusting for age, sex, ASA score, operated hematoma side, and preoperative mRS) and to examine factors affecting functional recovery by modeling mRS improvement; baseline mRS was included to address ceiling effects.
To evaluate potential selection bias in surgical technique assignment, a logistic regression analysis was performed to assess whether patient frailty markers (age, ASA score, preoperative mRS, and living status) influenced the choice between keyhole and burr hole approaches. This analysis was necessary to confirm that surgical technique selection was based solely on surgeon preference rather than on patient characteristics, which could otherwise confound the observed survival differences.
Interrater reliability for TMT measurements was quantified using intraclass correlation coefficients (ICCs) based on a two-way mixed-effects model.
A p<0.05 was considered statistically significant throughout the analyses.
Results
A total of 105 patients were included. The median observation time was 55.0 months (interquartile range: 30.0-91.0), and 46.7% were followed for 5 years or longer. Cohort characteristics are presented in . Interrater reliability for TMT measurements was excellent (ICC >0.9). Overall survival was 96.2% at 3 months, 91.4% at 12 months, 86.6% at 24 months, and 63.7% at 60 months; 41 deaths (39.0%) were observed.
Table 1. Patient characteristics
Characteristic | Two-year mortality | Overall mortality | Total (n=105) | Unadjusted HR (95% CI) | |||
|---|---|---|---|---|---|---|---|
Alive (n=91) | Deceased (n=14) | Alive (n=64) | Deceased (n=41) | ||||
Age | Mean (SD) | 68.1 (14.4) | 79.6 (10.2) | 65.2 (14.6) | 76.5 (11.3) | 69.6 (14.4) | 1.07 (1.03-1.10)* |
ASA score | Mean (SD) | 2.3 (0.9) | 2.7 (1.0) | 2.3 (0.9) | 2.6 (0.8) | 2.4 (0.9) | 1.43 (0.99-2.07) |
TMT (mm) | Mean (SD) | 5.8 (1.5) | 4.4 (1.9) | 6.0 (1.6) | 5.0 (1.6) | 5.6 (1.6) | 0.69 (0.54-0.89)* |
Midline shift (mm) | Mean (SD) | 6.6 (4.5) | 7.2 (5.3) | 6.4 (4.6) | 7.3 (4.6) | 6.7 (4.6) | 1.04 (0.97-1.11) |
cSDH thickness (mm) | Mean (SD) | 20.3 (7.6) | 22.9 (11.5) | 19.8 (7.8) | 22.0 (8.7) | 20.6 (8.2) | 1.04 (1.00-1.08) |
Hemoglobin (g/dL) | Mean (SD) | 12.8 (1.9) | 13.1 (8.1) | 12.9 (1.9) | 12.7 (4.9) | 12.8 (3.4) | 0.95 (0.82-1.11) |
Albumin (g/L) | Mean (SD) | 41.4 (4.0) | 36.6 (6.0) | 41.5 (4.2) | 39.5 (5.0) | 40.7 (4.6) | 0.89 (0.83-0.96)* |
Male sex | n (%) | 71 (78.0) | 8 (57.1) | 52 (81.2) | 27 (65.9) | 79 (75.2) | 0.54 (0.28-1.03) |
Thin TMT (age- and sex-adjusted) | n (%) | 43 (47.3) | 11 (78.6) | 28 (43.8) | 26 (63.4) | 54 (51.4) | 1.86 (0.98-3.51) |
Bilateral hematoma | n (%) | 19 (20.9) | 5 (35.7) | 15 (23.4) | 9 (22.0) | 24 (22.9) | 1.01 (0.48-2.11) |
Burr hole surgery | n (%) | 55 (60.4) | 9 (64.3) | 32 (50.0) | 32 (78.0) | 64 (61.0) | 2.15 (1.02-4.52)* |
Continuous variables are presented as mean (standard deviation); categorical variables are presented as n (%). Two-year mortality denotes death within 24 months of surgery. Unadjusted HR were obtained from univariable Cox proportional hazards models for overall mortality, each fitted with a single covariate; continuous variables were modelled per one-unit increase in the covariate. Between-group differences in the descriptive columns were assessed with Student’s t-test for normally distributed continuous variables, the Mann-Whitney U test for non-normally distributed variables, and the chi-square or Fisher’s exact test for categorical variables. Thin TMT was defined as measured TMT values below those predicted by a linear model including age and sex; values at or above the predicted value were classified as Thick, *: p<0.05 ASA: American Society of Anesthesiologists, CI: Confidence interval, HR: Hazard ratio, TMT: Temporal muscle thickness, cSDH: Chronic Subdural Hematoma, SD: Standard deviation
To evaluate the influence of demographic factors on TMT, we constructed linear regression models. A sex-adjusted model explained 6.9% of the variance in TMT (R2=0.069, p=0.007), with males exhibiting significantly greater TMT than females (β=+0.99 mm, 95% CI: 0.28 -1.71, p=0.007). Incorporating age improved the model fit (R2=0.165, p<0.001), with older age associated with reduced TMT (β=-0.035 mm/year, p=0.001) and male sex remaining a significant predictor (β=+0.918 mm, p=0.009) ().
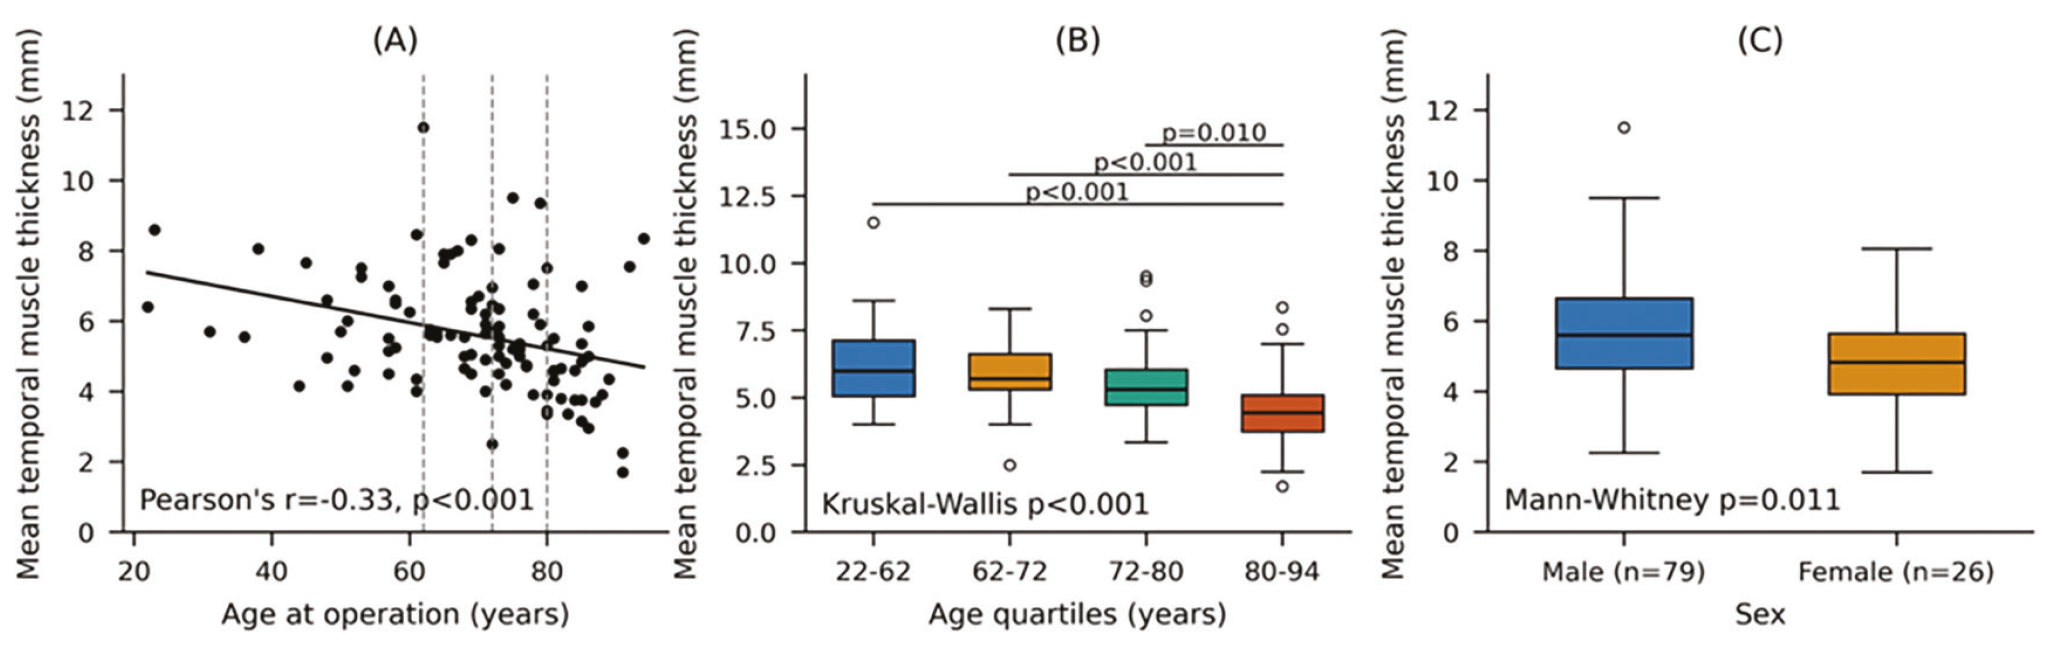
(A) Shows the negative correlation between age and mean temporal muscle thickness in cSDH patients. The scatterplot demonstrates a significant inverse relationship (Pearson’s r=-0.33, p<0.001), indicating that TMT decreases with increasing age. (B) Displays TMT distribution across four age quartiles using boxplots. The Kruskal-Wallis test confirms significant differences between age groups (p<0.001), with pairwise comparisons showing that the oldest quartile differs significantly from each of the three younger quartiles (p<0.001, p<0.001, and p=0.010). (C) Compares TMT between male and female patients, illustrating that male patients have significantly thicker temporal muscles than female patients (Mann-Whitney p=0.011)
cSDH: Chronic Subdural Hematoma, TMT: Temporal Muscle Thickness
Kaplan-Meier survival analysis of sex-adjusted TMT categories (“Thin” vs. “Thick”) showed no significant difference in survival (log-rank p=0.149); 60-month survival rates were 71.9% for the “Thick” group and 57.2% for the “Thin” group (). However, after further adjustment for age, the survival disparity between the groups approached statistical significance (log-rank p=0.053). The age- and sex-adjusted “Thick” group demonstrated higher survival probabilities at all time points: 98.0% vs. 94.4% at 3 months; 96.1% vs. 87.0% at 12 months; 94.1% vs. 79.6% at 24 months; and 74.6% vs. 54.1% at 60 months. Median survival time in the “Thick” group was not reached, compared with 83.0 months in the “Thin” group ().
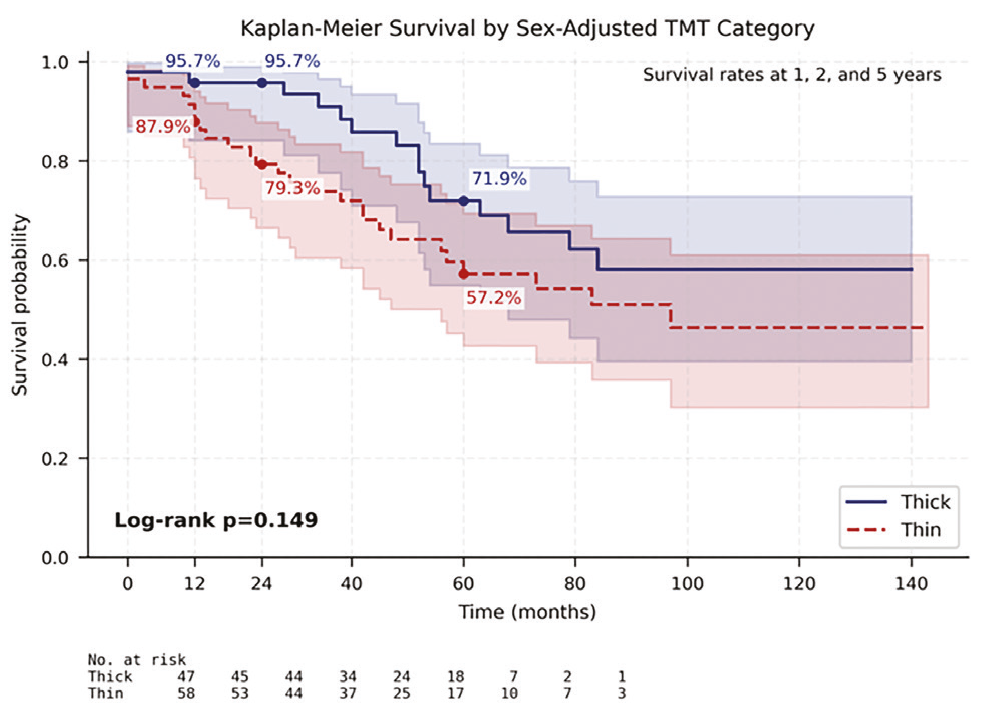
Kaplan-Meier survival curves for patients with chronic subdural hematoma, stratified by sex-adjusted temporal muscle thickness categories. Patients were classified as having “Thick” (solid blue line) or “Thin” (dashed red line) temporal muscles based on a sex-adjusted linear regression model. The 60-month survival rate was 71.9% in the “Thick” group and 57.2% in the “Thin” group. The shaded areas represent 95% confidence intervals. Despite this difference in survival rates, the curves did not reach statistical significance (log-rank p=0.149)
TMT: Temporal muscle thickness
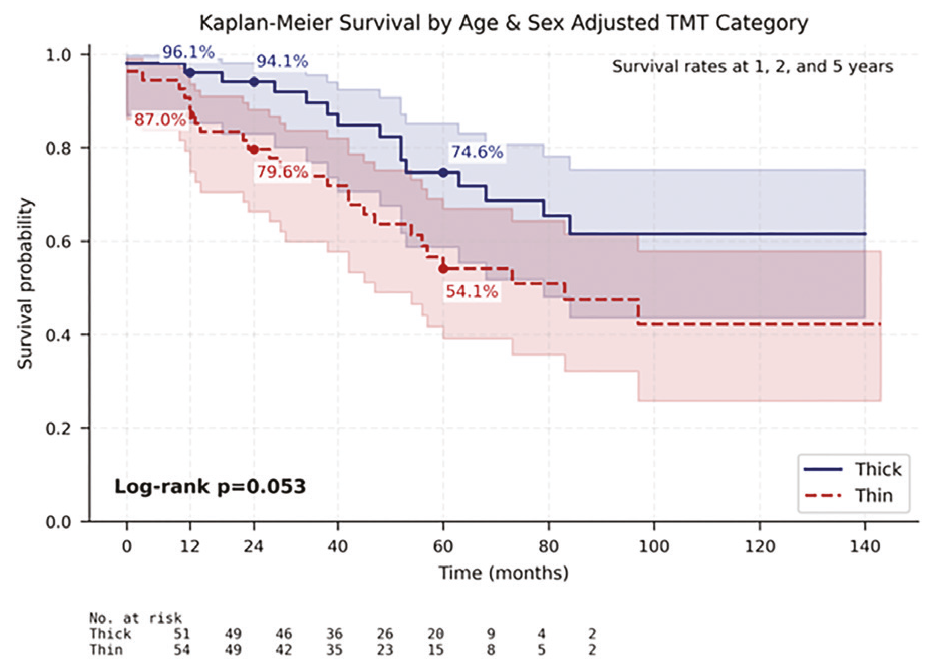
Kaplan-Meier survival curves for patients with chronic subdural hematoma, stratified by age- and sex-adjusted temporal muscle thickness categories. The solid blue line represents patients with “Thick” temporal muscles, while the dashed red line represents patients with “Thin” temporal muscles, after adjustment for both age and sex. Shaded areas represent 95% confidence intervals. The difference between the groups approached statistical significance (log-rank p=0.053). Survival rates at key time points (1, 2, and 5 years) are shown on the graph for both groups
TMT: Temporal muscle thickness
To examine the relationship between frailty markers and TMT, a multivariable linear regression model was constructed, including age, sex, ASA score, preoperative mRS, living status, albumin levels, leukocyte counts, and hemoglobin levels (). The model accounted for 30.1% of the variance in TMT (R2=0.301, p<0.001). Frailty markers were significantly correlated with TMT, with older age, female sex, and dependent living status predicting reduced TMT, whereas higher ASA scores were associated with greater TMT. Notably, albumin levels and hematological parameters did not reach statistical significance in this comprehensive model. Receiver operating characteristic curve analysis identified sex-specific TMT cut-off values for predicting two-year mortality: 5.625 mm for males [area under the curve (AUC) 0.68; sensitivity 87.5%, specificity 52.1%] and 3.450 mm for females (AUC 0.79; sensitivity 66.7%, specificity 100%) ().
Table 2. Multivariable linear regression model for temporal muscle thickness
Variable | Coefficient (β) | Standard error | 95% CI | p-value |
|---|---|---|---|---|
Demographic factors | ||||
Age (years) | -0.024 | 0.011 | -0.046 to -0.002 | 0.032* |
Sex (male vs. female) | 0.765 | 0.340 | 0.090 to 1.441 | 0.027* |
Frailty markers | ||||
ASA score | 0.554 | 0.203 | 0.150 to 0.957 | 0.008* |
Preoperative mRS | -0.127 | 0.150 | -0.424 to 0.170 | 0.399 |
Living status | -0.936 | 0.366 | -1.663 to -0.210 | 0.012* |
Nutritional markers | ||||
Albumin (g/L) | 0.070 | 0.036 | -0.002 to 0.141 | 0.055 |
Hematological parameters | ||||
Leukocyte count (×10/µL) | 0.001 | 0.054 | -0.107 to 0.108 | 0.988 |
Hemoglobin (g/dL) | 0.042 | 0.045 | -0.047 to 0.130 | 0.351 |
Ordinary least-squares multivariable linear regression with TMT (mm) as the dependent variable [n=105; R2=0.301, adjusted R2=0.243; F(8,96)=5.18, p<0.001]. Coefficients express the change in TMT in millimetres per one-unit increase in the predictor; sex is coded male=1, female=0, and living status is coded as an ordinal score of increasing dependency, *: p<0.05 CI: Confidence interval, ASA: American Society of Anesthesiologists, mRS: modified Rankin scale, TMT: Temporal muscle thickness
Table 3. Sex-specific temporal muscle thickness cut-off values for two-year mortality
Sex | n | Two-year deaths | Cut-off (mm) | Youden J | AUC | Sensitivity/specificity (%) |
Male | 79 | 8 | 5.625 | 0.396 | 0.680 | 87.5/52.1 |
Female | 26 | 6 | 3.450 | 0.667 | 0.792 | 66.7/100.0 |
Cut-off values were derived from receiver operating characteristic curve analysis of preoperative TMT for prediction of death within 24 months by maximizing Youden’s index; calculations were performed separately by sex. Candidate thresholds were set at midpoints between consecutive observed values. Given the small number of two-year deaths within each sex stratum, these thresholds are exploratory and have not been externally validated AUC: Area under the curve, TMT: Temporal muscle thickness
Two multivariate Cox proportional hazards models were constructed to assess predictors of overall mortality (). Model A included TMT alongside traditional clinical variables, while Model B excluded TMT to evaluate model stability. Both models demonstrated excellent concordance (0.81) and identified consistent independent predictors of mortality. Age, lower albumin levels, dependent living status, keyhole surgical technique, and bilateral hematoma location emerged as significant prognostic factors. Notably, TMT did not reach statistical significance as an independent predictor after adjustment for established clinical markers.
Table 4. Multivariable Cox regression models for overall mortality
Variable | Model A (with TMT) | Model B (without TMT) | ||||
|---|---|---|---|---|---|---|
HR | 95% CI | p-value | HR | 95% CI | p-value | |
Age (per year) | 1.06 | 1.02-1.10 | <0.005* | 1.07 | 1.03-1.11 | <0.005* |
Male sex | 0.53 | 0.24-1.19 | 0.12 | 0.50 | 0.23-1.09 | 0.08 |
ASA score | 0.81 | 0.45-1.44 | 0.47 | 0.78 | 0.44-1.39 | 0.41 |
Preoperative mRS | 1.26 | 0.88-1.80 | 0.21 | 1.28 | 0.90-1.82 | 0.18 |
Hematoma thickness (mm) | 1.02 | 0.97-1.08 | 0.43 | 1.02 | 0.97-1.08 | 0.41 |
Midline shift (mm) | 1.04 | 0.95-1.14 | 0.36 | 1.04 | 0.95-1.14 | 0.39 |
Albumin (g/L) | 0.92 | 0.84-1.00 | 0.05 | 0.91 | 0.84-0.99 | 0.03* |
Leukocyte count (×103/µL) | 1.10 | 0.96-1.25 | 0.17 | 1.10 | 0.96-1.25 | 0.17 |
Hemoglobin (g/dL) | 0.97 | 0.80-1.17 | 0.74 | 0.96 | 0.79-1.17 | 0.71 |
Keyhole vs. burr hole | 0.18 | 0.07-0.47 | <0.005* | 0.18 | 0.07-0.47 | <0.005* |
Living status | 2.58 | 1.07-6.24 | 0.04* | 2.66 | 1.10-6.42 | 0.03* |
Left vs. right | 0.75 | 0.32-1.76 | 0.50 | 0.73 | 0.31-1.71 | 0.47 |
Bilateral vs. right | 3.23 | 1.22-8.55 | 0.02* | 3.17 | 1.20-8.33 | 0.02* |
TMT (mm) | 0.94 | 0.72-1.21 | 0.61 | - | - | - |
Multivariable Cox proportional hazards regression (n=105; 41 deaths). Model A includes TMT as a covariate (concordance 0.81; likelihood-ratio test p<0.001); Model B excludes TMT (concordance 0.81; likelihood-ratio test p<0.001). Both models were adjusted for age, sex, ASA score, preoperative mRS, hematoma thickness, midline shift, albumin, leukocyte count, hemoglobin, surgical technique, living status, and hematoma laterality. Right-sided hematoma was the reference category for laterality, and burr hole craniostomy was the reference category for surgical technique. Continuous variables are modelled per one-unit increase, *: p<0.05 ASA: American Society of Anesthesiologists, CI: Confidence interval, HR: Hazard ratio, mRS: Modified Rankin scale, TMT: Temporal muscle thickness
A separate Cox regression model evaluating predictors of hematoma recurrence (n=17 events, overall rate of 16.2%) identified age (HR=1.06, 95% CI: 1.00-1.11, p=0.04) and midline shift (HR=1.16, 95% CI: 1.00-1.33, p=0.04) as significant predictors. Subgroup recurrence rates were as follows: right-sided, 13.9% (5/36); left-sided, 22.2% (10/45); and bilateral 8.3% (2/24). The age- and sex-adjusted TMT category was not associated with recurrence [Thick: 19.6% (10/51) vs. Thin: 13.0% (7/54), p=0.431]. Recurrence rates were comparable between the surgical techniques (burr hole: 20.3% vs. keyhole: 9.8%, p=0.246).
To confirm that surgical technique selection was not systematically influenced by patient characteristics, logistic regression analysis was performed using frailty markers (age, ASA score, preoperative mRS, and living status) as predictors of technique choice. The model demonstrated a poor fit (Pseudo R2=0.032, p=0.343), indicating that technique selection reflected surgeons’ preferences rather than patient-specific factors.
A Cox model incorporating preoperative TMT and the percent change in TMT at one month was examined. In this model, age (HR=1.05, 95% CI: 1.01-1.09, p=0.019), keyhole surgical technique (HR=0.22, 95% CI: 0.08-0.59, p=0.003), and dependent living status (HR=2.98, 95% CI: 1.18-7.56, p=0.021) remained significant predictors of mortality, whereas neither preoperative TMT (p=0.71) nor its percent change (p=0.10) contributed significantly.
In a linear regression model predicting mRS improvement among 90 patients (15 dropped out due to missing data), the overall model was significant [R2=0.465, F(6,83)=12.01, p<0.001]. Baseline mRS was strongly associated with improvement (β=0.777, p<0.001), indicating that patients with worse baseline function had more room to improve, which effectively addresses the ceiling effect. Additionally, mRS at discharge was a significant predictor (β=-0.524, p<0.001), with higher immediate postoperative mRS scores associated with less subsequent improvement. In contrast, age, sex, ASA score, and TMT were not significantly associated with mRS improvement (all p>0.28).
Discussion
This single-center retrospective cohort study evaluated TMT as a prognostic marker in surgically treated cSDH over a 10-year period. While TMT demonstrated expected demographic associations with age and sex, consistent with recent normative data (), it failed to independently predict survival or recurrence after adjustment for established clinical variables. These findings align with emerging evidence questioning the independent clinical utility of TMT in neurological conditions (,) and contribute to the ongoing debate regarding its role in cSDH prognostication.
The observed age- and sex-related variation in TMT is consistent with the normative reference values established by Pesonen et al. (), who demonstrated a progressive decline in TMT from the fourth decade onward, with males consistently maintaining higher values than females across all age groups. Our finding that these demographic factors accounted for 16.5% of TMT variance underscores a critical methodological point: studies that do not adjust for age and sex when interpreting TMT measurements risk attributing age-related muscle loss to disease-specific processes, potentially inflating TMT’s apparent prognostic utility.
The failure of TMT to independently predict survival after multivariate adjustment is consistent with findings from Yilmaz et al. () and Atalay et al. (), who similarly demonstrated that TMT associations with clinical outcomes were largely attenuated after adjustment for age and comorbidities across different neurological populations. The marginal survival trend observed in age- and sex-adjusted TMT categories (log-rank p=0.053) is intriguing but falls short of statistical significance and likely reflects the underpowered nature of this comparison rather than indicating a true null effect, as confirmed by our post-hoc power analysis.
The prognostic dominance of age, albumin, living status, and hematoma laterality over TMT reflects the multifactorial nature of cSDH outcomes. The independent association of albumin with mortality aligns with established evidence linking nutritional status to surgical outcomes in elderly neurosurgical patients (,) and supports the broader argument that systemic physiological reserve, rather than any single imaging-derived morphometric parameter, is the primary determinant of survival in this population. The significant mortality risk associated with bilateral hematomas likely reflects greater intracranial burden and a more severe underlying coagulopathy or atrophy-related vulnerability. The absence of a hemoglobin effect is consistent with external validation data from Holl et al. (), suggesting that hematological parameters add limited independent prognostic value once nutritional and functional status are accounted for.
An unexpected association was observed between the keyhole surgical technique and reduced mortality (HR=0.18, p<0.005). This finding must be interpreted with considerable caution for several reasons. First, surgical technique selection was based on individual surgeon preference rather than randomization. Although our logistic regression confirmed that frailty markers did not predict technique choice, unmeasured confounders-such as surgeon experience, intraoperative complexity, and subtle differences in patient selection criteria-cannot be excluded in a retrospective design. Second, the magnitude of this effect (HR=0.18) substantially exceeds what has been reported in the existing literature; a meta-analysis by Huang et al. (), including 3,559 surgeries, found comparable mortality outcomes between burr hole and craniotomy techniques, and a Turkish tertiary center similarly reported no survival advantage for craniotomy (). Current evidence has made this discordance more difficult to explain. The recent multidisciplinary guideline recommends burr-hole drainage with drain placement as first-line surgical management and reserves craniotomy for selected cases. It attributes no survival advantage to either approach (). The multicenter COMPACT randomized trial compared mini-craniotomy, twist-drill craniostomy, and burr hole craniostomy and found no significant difference in outcome between arms; burr hole craniostomy had the lowest reoperation rate (). Our estimate, therefore, conflicts with both observational and randomized evidence, which argue against a causal effect.
Third, our study was underpowered for subgroup analyses, and extreme HR in small retrospective cohorts are well-recognized statistical phenomena when the number of events is limited. The keyhole technique did not demonstrate a recurrence advantage over burr hole drainage (9.8% vs. 20.3%, p=0.246), further undermining a straightforward causal interpretation. Regarding drainage systems, the closed Jackson-Pratt drain used in keyhole procedures versus the open Penrose drain in burr hole procedures may theoretically influence outcomes, though studies have not demonstrated consistent infection-related advantages of closed systems (,). We therefore present this finding as hypothesis-generating only and strongly advocate conducting prospective randomized trials before any practice-changing conclusions are drawn.
Our recurrence rate of 16.2% falls within the 10-20% range reported after burr hole drainage (). Our cohort was therefore not unusually low-risk, which strengthens the finding that TMT was unrelated to recurrence. This is clinically important because recurrence imposes a substantial burden. After reoperation for a first recurrence, a further 20% of patients recur, and most are left with residual symptoms and moderate-to-poor functional recovery (). If sarcopenia contributed to the inflammatory and angiogenic cycle that drives hematoma reaccumulation, TMT should have predicted recurrence. Recurrence was predicted by age and midline shift, both of which reflect intracranial processes rather than muscle mass. TMT, therefore, appears to index general physiological reserve rather than any hematoma-specific mechanism, and preoperative morphometry is unlikely to identify patients at risk of recurrence.
Du et al. () raised several important methodological concerns regarding TMT studies in cSDH, advocating for comprehensive frailty assessment beyond single morphometric parameters. Our study partially addresses these concerns by incorporating albumin as a nutritional marker, standardizing surgical protocols, and examining hematoma laterality as an independent variable. However, we acknowledge that relying on TMT and albumin alone provides an incomplete picture of patient frailty. Validated multidimensional frailty instruments, such as the Charlson Comorbidity Index or the modified frailty index, and inflammatory markers such as C-reactive protein and lymphocyte count were not available in our retrospective dataset. This gap is now more consequential because current guidance recommends screening every admitted cSDH patient with a validated frailty tool such as the clinical frailty scale and referring those who screen positive for comprehensive geriatric assessment (). Any future claim that TMT adds prognostic information will therefore have to be tested against a frailty score already collected in routine care, rather than against age and comorbidity alone. This limitation is not unique to our study; Mohajerani et al. () similarly noted that multiple confounders, including age, sex, comorbidities, nutritional status, and preexisting frailty, may influence the independent prognostic value of TMT in neurological populations. Prospective studies should incorporate standardized frailty assessment tools alongside TMT to determine whether a composite frailty score provides superior prognostic discrimination compared with TMT alone.
Study Limitations
This study has several limitations that should be considered when interpreting its findings. The single-center retrospective design limits generalizability to other institutional settings, and the assignment of surgical technique was based on surgeon preference rather than randomization, introducing potential residual confounding despite our logistic regression validation. The sample size of 105 patients, while comparable to prior TMT studies in cSDH (,), may limit the statistical power of subgroup analyses. Post-hoc power analysis of the Thin versus Thick TMT survival comparison revealed that 41 observed events provided approximately 72% power to detect the HR of 0.48, falling short of the 57 events required for 80% power. Accordingly, the non-significant trend observed (log-rank p=0.053) may reflect insufficient statistical power rather than a true absence of effect, and the potential prognostic role of TMT cannot be definitively excluded. The relatively small number of recurrence events (n=17) further limits the recurrence analysis, and the results should be interpreted cautiously. The sex-specific TMT cut-off values derived from our cohort should be interpreted cautiously due to the relatively small sample size and the lack of external validation. Additionally, our retrospective design precluded the incorporation of validated multidimensional frailty instruments, such as the Charlson Comorbidity Index and the modified frailty index, and inflammatory markers, such as C-reactive protein and lymphocyte count, limiting the comprehensiveness of frailty assessment. The one-month postoperative TMT follow-up may also be insufficient to capture longer-term changes in muscle mass. Finally, our study period predates the adoption of middle meningeal artery embolization at our center, and the few patients who received it were excluded by design. Since randomized and pooled data now indicate that adjunctive embolization approximately halves the risk of recurrence without a demonstrable effect on mortality or functional outcome (), our results should be read as applying to conventionally operated patients; whether TMT retains prognostic value in cohorts managed with embolization remains untested.
Despite these limitations, this study offers notable strengths. The 10-year follow-up, with a median of 55.0 months and nearly half of patients exceeding 5 years, substantially exceeds durations reported in prior TMT studies. The rigorous age- and sex-adjusted TMT methodology, the excellent interrater reliability (ICC>0.9), and the inclusion of surgical technique and hematoma laterality as previously unexamined covariates represent meaningful methodological contributions to the field.
Conclusion
Temporal muscle thickness does not independently predict survival or recurrence in surgically treated cSDH patients when traditional clinical markers are considered. Age, albumin levels, living situation, and hematoma laterality remain robust prognostic determinants. The marginal survival trend observed in age- and sex-adjusted TMT categories warrants further investigation in larger, prospective, multicenter cohorts with adequate statistical power. The unexpected association between the keyhole technique and survival, while hypothesis-generating, requires validation through randomized controlled trials before clinical implications can be drawn.
Ethics
Ethics Committee Approval: Ethical approval was obtained from the Ege University Ethics Committee (approval number: 24-3T/34, date: 07.03.2024).
Informed Consent: The patients consent to participate was obtained using the ethics committee-approvaed form.
Footnotes
Authorship Contributions
Concept: H.B., E.O., T.Y., Design: B.B.A., E.E.C., Data Collection or Processing: B.B.A., E.E.C., M.S.B., Analysis or Interpretation: B.B.A., M.S.B., Literature Search: B.B.A., E.E.C., Writing: B.B.A., E.E.C., M.S.B., H.B., E.O., T.Y.
Conflict of Interest
The authors declared that there were no conflicts of interest.
Financial Disclosure
The authors declared that this study received no financial support.
Declaration Regarding the Use of AI and AI-Assisted Technologies: During the preparation of this work, the authors used Claude Sonnet 4 (Anthropic, San Francisco, CA, USA) to check the grammar and improve the flow of sentences. After using this tool, the authors reviewed and edited the content as needed and take full responsibility for the content of the publication.
References
Dziho A, Al Awadhi A, Mollica C, et al. Global prevalence and incidence of chronic subdural hematoma: a systematic review. Brain Spine. 2025;5:105893.
Zhu F, Wang H, Li W, et al. Factors correlated with the postoperative recurrence of chronic subdural hematoma: an umbrella study of systematic reviews and meta-analyses. EClinicalMedicine. 2021;43:101234.
Nouri A, Gondar R, Schaller K, Meling T. Chronic subdural hematoma (cSDH): a review of the current state of the art. Brain Spine. 2021;1:100300.
Posti JP, Luoto TM, Sipilä JOT, Rautava P, Kytö V. Prognosis of patients with operated chronic subdural hematoma. Sci Rep. 2022;12:7020.
Furtner J, Weller M, Weber M, et al. Temporal muscle thickness as a prognostic marker in patients with newly diagnosed glioblastoma: translational imaging analysis of the CENTRIC EORTC 26071–22072 and CORE trials. Clin Cancer Res. 2022;28:129-36.
Du X, Chen G, Ren Z. Comment on: ‘reduced temporal muscle thickness predicts shorter survival in patients undergoing chronic subdural haematoma drainage’ by Korhonen et al. J Cachexia Sarcopenia Muscle. 2024;15:2879-80.
Dubinski D, Won SY, Behmanesh B, et al. Significance of temporal muscle thickness in chronic subdural hematoma. J Clin Med. 2022;11:6456.
Korhonen TK, Arponen O, Steinruecke M, et al. Reduced temporal muscle thickness predicts shorter survival in patients undergoing chronic subdural haematoma drainage. J Cachexia Sarcopenia Muscle. 2024;15:1441-50.
Yilmaz E, Arsava EM, Topcuoglu MA. Temporalis muscle thickness: ultrasound measurement, clinical significance and correlation with sarcopenic indices. Clin Nutr. 2025;54:140-52.
Atalay B, Erincik K, Dogan MB, Gezgin M, Yildiz H, Ozdilek B. The impact of temporal muscle thickness as an indicator of sarcopenia on clinical status in Parkinson’s disease. Clin Neurol Neurosurg. 2026;265:109388.
Pesonen EK, Arponen O, Niinimäki J, et al. Age- and sex-adjusted CT-based reference values for temporal muscle thickness, cross-sectional area and radiodensity. Sci Rep. 2025;15:2393.
Stubbs DJ, Davies BM, Edlmann E, et al. Clinical practice guidelines for the care of patients with a chronic subdural haematoma: multidisciplinary recommendations from presentation to recovery. Br J Neurosurg. 2026;40:94-103.
Kan P, Fiorella D, Dabus G, et al. ARISE i consensus statement on the management of chronic subdural hematoma. Stroke. 2024;55:1438-48.
Fakhry R, Yesildal C, Bartek J, et al. Updated systematic review of current randomised controlled trials in chronic subdural haematoma. Acta Neurochir (Wien). 2025;167:288.
Wang S, Ma Y, Zhao X, et al. Risk factors of hospital mortality in chronic subdural hematoma: a retrospective analysis of 1117 patients, a single institute experience. J Clin Neurosci. 2019;67:46-51.
Zhu B, Yu X, Ou Y, Guo X, Liu W, Wu L. Nutritional and inflammatory peripheral blood markers for risk assessment of chronic subdural hematoma: a case-control study. Clin Neurol Neurosurg. 2023;227:107640.
Holl DC, Mikolic A, Blaauw J, et al. External validation of prognostic models predicting outcome after chronic subdural hematoma. Acta Neurochir (Wien). 2022;164:2719-30.
Huang YW, Yin XS, Li ZP. Burr hole craniostomy vs. minicraniotomy of chronic subdural hematoma: a systematic review and meta-analysis. Eur Rev Med Pharmacol Sci. 2022;26:4983-90.
Hamzaoglu V, Özalp H, Avcı E, Bağdatoğlu C, Dağtekin A. Surgical treatment outcomes of our patients with chronic subdural hematoma: a review of seventy six cases. Ankara Üniversitesi Tıp Fakültesi Mecmuası. 2018;71:251-55.
Bakhti S, Tighilt N, Djennas M. Open drainage in chronic subdural hematomas: a prospective study of 189 cases. Iran J Neurosurg. 2016;2:15-9.
Morales-Gómez JA, Garcia-Estrada E, Garza-Báez A, Mercado-Flores M, de León AMP. Subdural open drains as an effective and low-cost modality for the treatment of chronic subdural hematomas. Br J Neurosurg. 2023;37:1078-81.
de Rooij MJ, van der Boog ATJ, Carter SH, Robe PAJT, van der Zwan A, Niknejad HR. Clinical outcome of redo-surgery for recurrent chronic subdural hematoma: a systematic review and meta-analysis combined with a case series. World Neurosurg. 2025;202:124377.
Mohajerani E, Gümüs M, Dinger TF, et al. Temporal muscle thickness as a feasible sarcopenia marker and outcome predictor after aneurysmal subarachnoid hemorrhage. Acta Neurochir (Wien). 2025;167:57.
Mohammadzadeh I, Hajikarimloo B, Zare A, et al. Efficacy of middle meningeal artery embolization combined with surgery versus standalone surgery for chronic subdural hematoma: a comprehensive systematic review and meta-analysis with separate analysis of randomized controlled trials. Neuroradiology. 2025;67:2897-919.